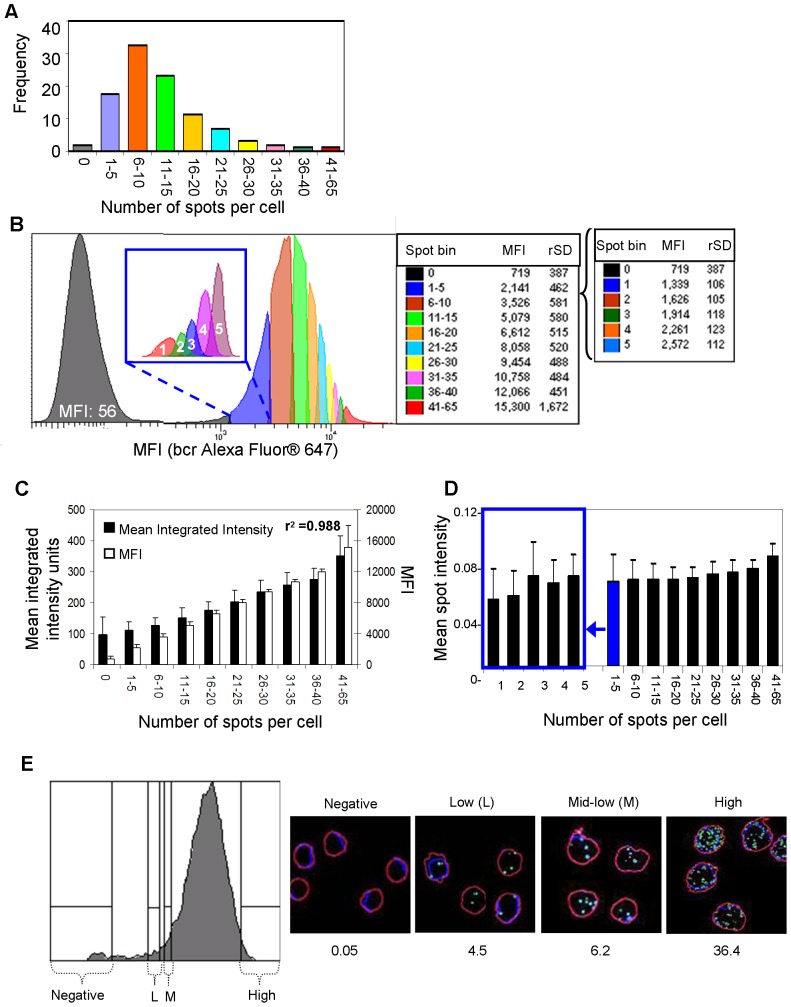
Figure 5. Validation of the sensitivity of RNA flow cytometry.
(a) Breakdown of spot numbers from image analysis (bcr+18 s+DAPI+) into bins (x-axis) with corresponding frequencies (y-axis). (b) RNA flow histogram of K562 cells split into groups using the percentages obtained in Figure 5A with the corresponding MFIs (x-axis and table). Colors correspond to the spot bin numbers in the bar chart in 5a. The lowest bin (spot count 1–5) was further subdivided and is shown in the inset on the histogram with the corresponding spot count on each peak. (c) Comparison chart of mean integrated intensities (black bars) obtained from image analysis and MFIs (white bars) obtained from RNA flow cytometry analysis (5b). Standard deviations are shown for each group. The coefficient of determination (r2) is displayed on the graph (0.988). (d) Spot intensities for each spot bin with correlating standard deviations for each group. The lower bin (1–5) was further subdivided and is shown on the left side of the chart. (e) Histogram showing sort gates for the different bcr MFI subsets in the K562 cell line. Outline overlay images shown to the right of the histogram are representative of the sorted cells from each subset sorted showing bcr RNA (green), 18 s rRNA (red), and DAPI counterstaining (blue). The bcr spot count average per cell is listed below its respective image.

