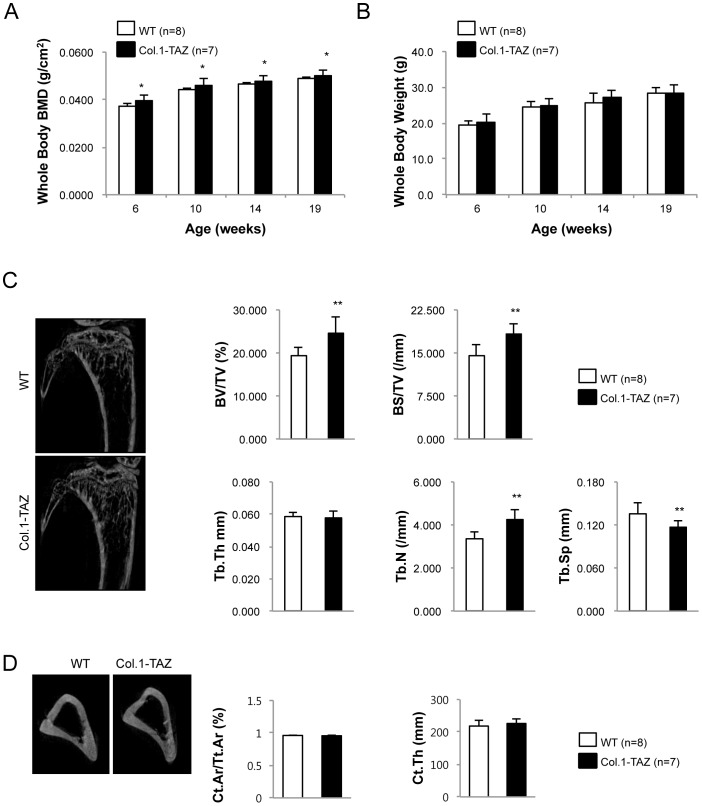
Figure 2. Body weight and bone phenotype in Col.1–TAZ mice.
Total body BMD (A) was analyzed by dual energy X-ray absorptiometry (PixiMus). Body weight (B) was measured in male Col.1– TAZ mice and their WT littermates at 6, 10, 14, and 19 weeks (* p<0.05 vs. WT). (C) Representative μCT images of the proximal tibia from a 20-week-old male Col.1–TAZ mouse and its WT littermate. Static morphometric parameters including trabecular bone volume expressed as percentage of total tissue volume (BV/TV), trabecular number (Tb.N), trabecular thickness (Tb.Th), and trabecular spacing (Tb.Sp) were measured with the CT images. (D) Representative μCT images of the mid-femur from a 20-week-old male Col.1–TAZ mouse and its WT littermate. Cortical histomorphometric parameters were analyzed for cortical bone area (Ct.Ar) and average cortical thickness (Ct.Th) (* p<0.05 vs. WT littermates). Data are expressed as means ± SD.

