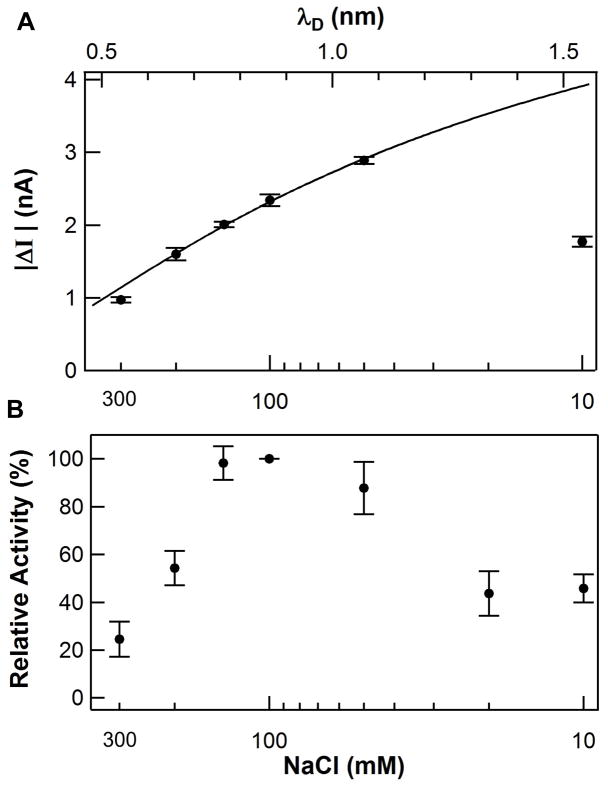
Fig. 2.
Debye screening of signal transduction. (A) The signal amplitude ΔI of a typical lysozyme SWNT FET as a function of the buffer salt concentration (bottom axis) and corresponding Debye length λD (top axis). The solid line is a fit to the Debye-Huckel screening model described in the text. Note that the phosphate buffer includes an additional 10 mM sodium phosphate. (B) Ensemble measurements of lysozyme activity over the same concentration range show varying enzymatic activity. The drop in activity and thus signal transduction at the lowest salt concentrations is likely due to enzyme denaturation. All error bars depict ±1σ.

