
Fig 1.
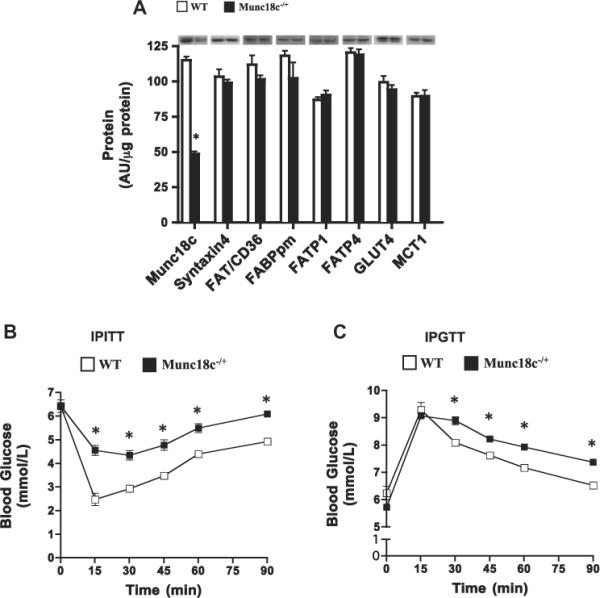
Muscle protein content of Munc18c, syntaxin4, and glucose and FA transport proteins (A), IPITT (B), and IPGTT (C) in WT and Munc18c−/+ mice. N = 4–6, mean ± sem. Error bars are smaller than symbols in B an C. As noted in Section 2, Ponceau staining was used to confirm equal loading of proteins. MCT1, a monocarboxylate transporter, served as a positive control. *p < 0.05, Munc18c−/+ vs WT mice.