Figure 1.
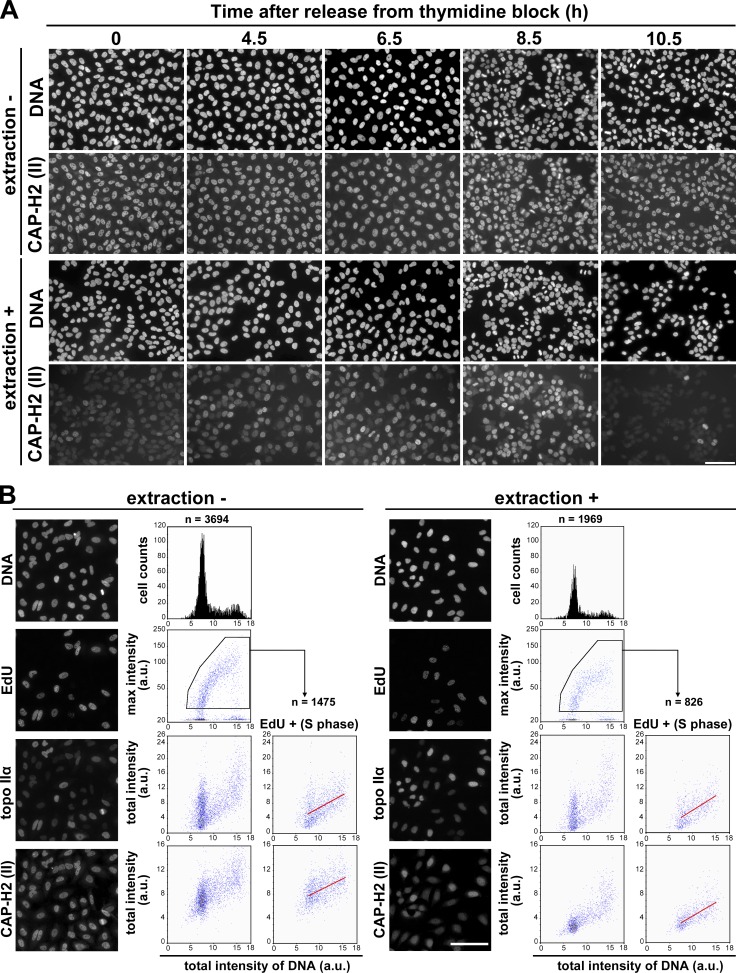
Condensin II changes its chromatin-binding property during S phase. (A) HeLa cells were synchronized by means of double thymidine block and release. Cells were fixed at the time points indicated after release and immunolabeled with anti–CAP-H2 (extraction −). Alternatively, the same set of cells was treated with a detergent-containing buffer before fixation and processed for immunofluorescence labeling (extraction +). Bar, 100 µm. (B) Asynchronously grown HeLa cells were pulse labeled with EdU, fixed, and immunolabeled with anti–topo IIα and anti–CAP-H2 (extraction −). Alternatively, the same set of cells was treated with a detergent-containing buffer before fixation and processed in the same way (extraction +). Quantitative imaging analyses were performed using CELAVIEW RS100. The first row shows DAPI-stained images and profiles of total intensity of DNA per nucleus (x axis) and cells counted (y axis). The second row shows EdU-labeled images and scattergrams of DNA intensity and max intensity of EdU. The third and fourth rows show topo IIα– and CAP-H2–labeled images and scattergrams of DNA intensity and total nuclear intensity of topo IIα and CAP-H2. In the right panels of the third and fourth rows (EdU +), the data of EdU-positive cells were extracted from the pentagonal areas in the second row, and plotted in the same way. In the scattergrams of EdU-positive cells, regression lines were drawn in red. Bar, 100 µm.

