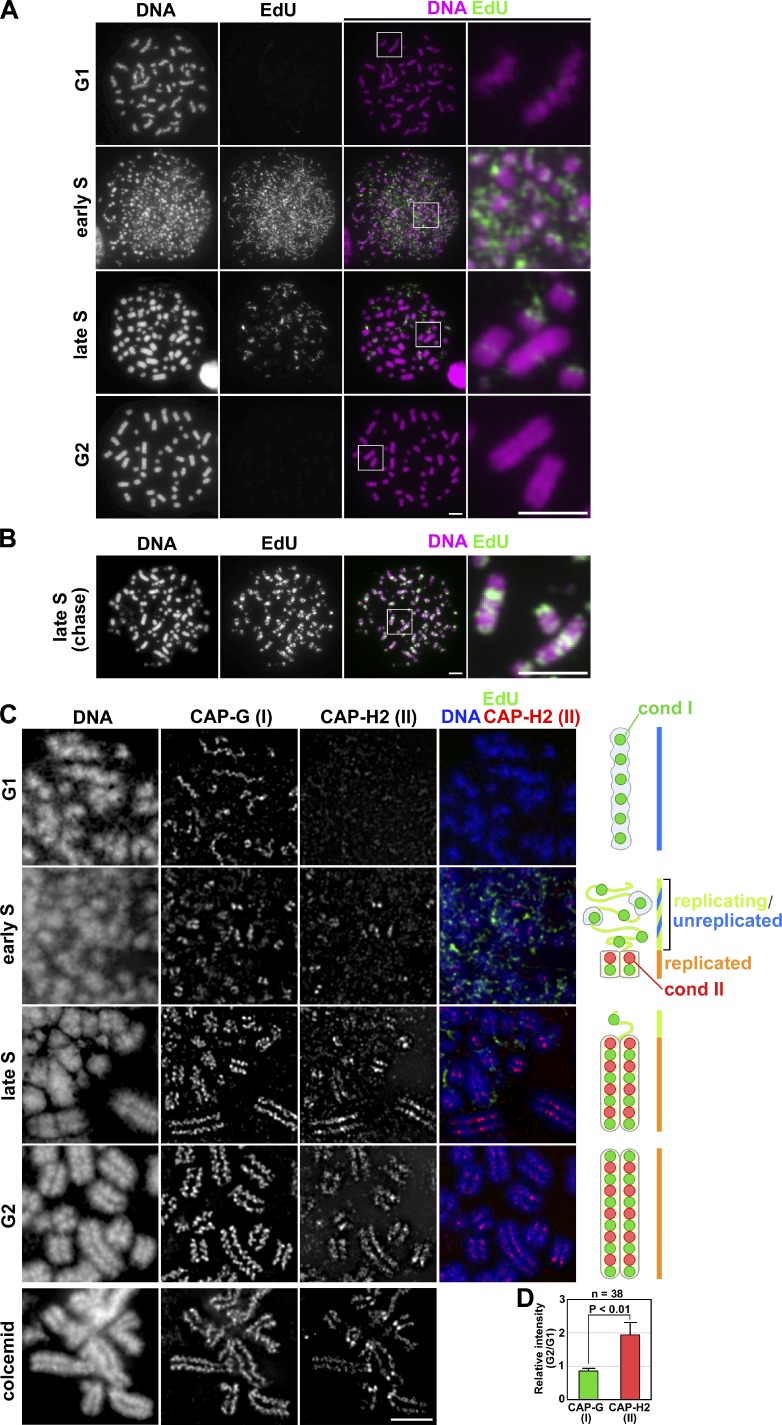
Figure 2.
Advanced PCC assays show that condensin II forms sister axes in replicated regions of chromosomes in S phase cells. (A) Asynchronously grown lymphoblastoid cells were pulse labeled with EdU and then treated with calyculin A. The cells were subjected to a hypotonic treatment, fixed with Carnoy’s solution, and spread onto glass slides. The cell cycle stages were judged by EdU-labeling patterns and chromosome morphology. Shown here are representative images of cells at different stages, along with their closeups. Bars, 5 µm. (B) Asynchronously grown lymphoblastoid cells were pulse labeled with EdU and chased for 3 h before treatment with calyculin A. Shown here is a representative image of late S-PCC. Bars, 5 µm. (C) Lymphoblastoid cells were subjected to the same treatment as A and processed for immunolabeling with antibodies against CAP-G and -H2 (see Materials and methods). As a control, metaphase chromosome spreads were prepared in the same way from a culture that had been treated with colcemid (bottom). Cartoons depict the localization of condensins I and II in PCC products at the different stages. Bar, 5 µm. (D) The intensity of fluorescence signals was measured using the Polygon tool of the DeltaVision, and normalized to the intensity of DAPI. Plotted here are the relative intensities of the G2-PCC chromatids to the G1-PCC chromatids (for CAP-G and -H2). The mean and SD were calculated from the data from three independent experiments. The total numbers examined were described in the figure.

