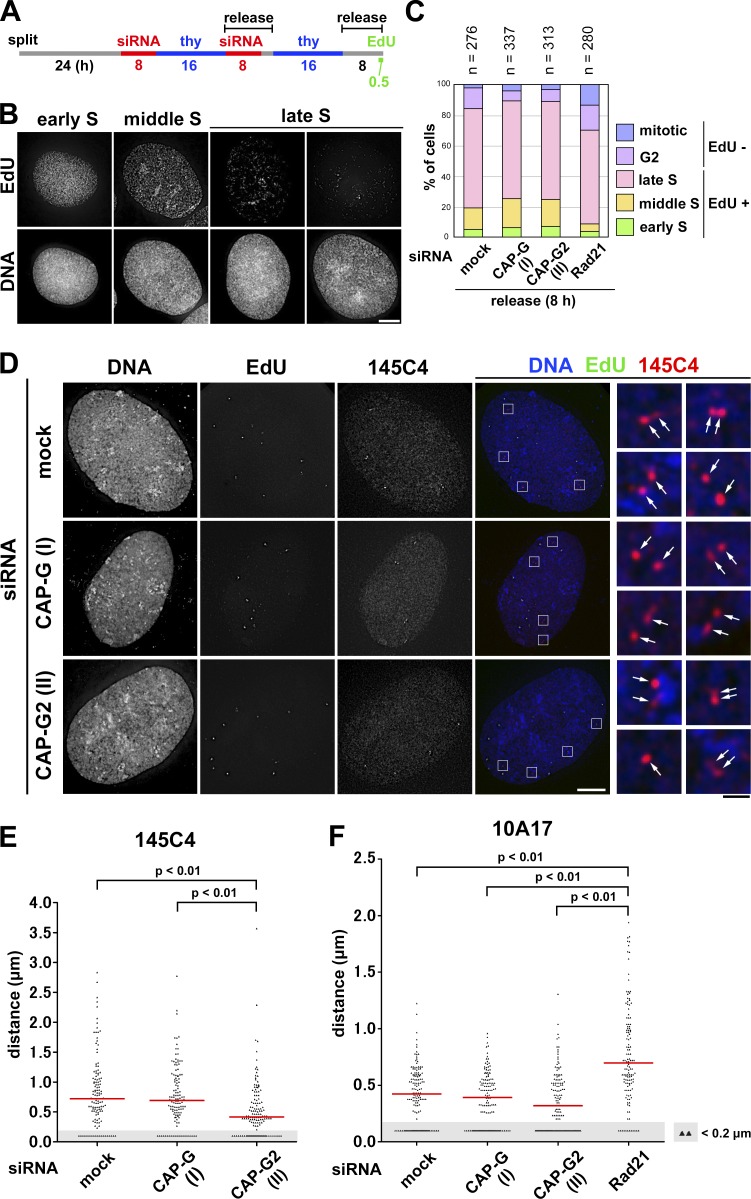
Figure 4.
FISH assays reveal that condensin II promotes disjoining of duplicated chromosomal loci during S phase. (A) Experimental protocol for enriching late S phase cells depleted of condensin subunits (see Fig. S2 E for cohesin depletion). Cells were pulse labeled with EdU before harvest. (B) After a hypotonic treatment, the cells were fixed with Carnoy’s solution and spread onto glass slides. EdU-positive cells were classified into early, middle, or late S on the basis of the EdU-labeling pattern. Representative images of cells at each stage are shown. Bar, 10 µm. (C) Plotted here are cell cycle stages that were judged on the basis of the EdU-labeling pattern and cell morphology. The data shown are from a single representative experiment out of two repeats. (D) FISH assays of a chromosomal locus whose sister distance is susceptible to condensin II depletion. HeLa cells mock depleted or depleted of CAP-G or -G2 were prepared as described in B and hybridized with the BAC clone 145C4. Cells in late S phase were selected as judged by the EdU-labeling pattern, and the distance between sister FISH signals was measured. Shown here are representative images of late S cells from the three different cultures, along with their merged closeups. FISH signals are indicated by the arrows. Bars: (white) 10 µm; (black) 1 µm. (E) Plots of the measured distance between sister FISH signals hybridized with 145C4. Under each condition, >120 pairs of sister FISH signals from late S cells were analyzed. For reasons of convenience, all values judged to be <0.2 µm, the limit of optical resolution, were plotted as 0.1 µm (as indicated by the shadowed areas). The red bar indicates the median value. (F) Plots of the measured distance between sister FISH signals hybridized with 10A17. Under each condition, >130 pairs of sister FISH signals from late S cells were analyzed. Each assessment shown in E and F was completed once. Detailed statistical data for FISH analyses are shown in Tables S1 and S2.

