Figure 5.
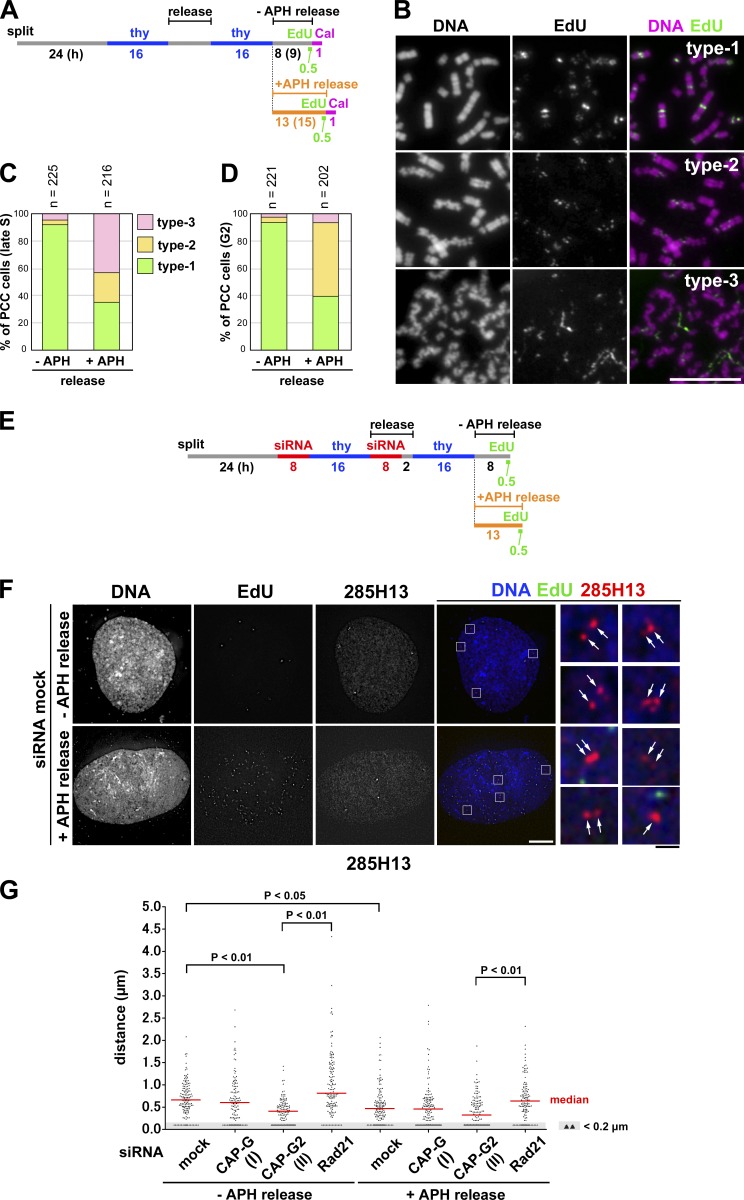
Application of mild replicative stress partially impairs sister chromatid resolution during S phase. (A) Experimental protocol for enriching late S and G2 phase cells from synchronized cultures treated with aphidicolin (APH) and/or calyculin A (Cal). HeLa cells were released in a medium with or without 0.1 µg/ml aphidicolin and pulse labeled with EdU before being treated with calyculin A. (B) Cells released for 8 (−APH release) or 13 h (+APH release) were fixed with Carnoy’s solution and spread onto glass slides. Late S cells were selected on the basis of EdU-labeling patterns. The morphology of PCC products was classified into three types, and representative images are shown. Bar, 10 µm. (C) Plotted here are the frequencies of the three types of morphology observed in late S-PCC cells. (D) Cells were incubated for an extended period (9 h, −APH release; 15 h, +APH release; see A) and fixed and treated as in B. G2 cells with no EdU signals were selected, and the frequencies of the three types of morphology observed are plotted. Each experiment shown in C and D was completed once. (E) Experimental protocol for enriching late S phase cells from synchronized cultures treated with siRNAs and aphidicolin. Cells were released in the absence or presence of aphidicolin and pulse-labeled with EdU before harvest. See Fig. S2 E for Rad21 depletion. (F) HeLa cells mock depleted or depleted of CAP-G, CAP-G2, or Rad21 were prepared, hybridized with the BAC clone 285H13, and analyzed as described in Fig. 4 D. Shown here are representative images of late S cells from the mock-depleted culture released in a medium with or without aphidicolin. FISH signals are indicated by the arrows. Bars: (white) 10 µm; (black) 1 µm. (G) Plots of the measured distance between sister FISH signals hybridized with 285H13. In each culture, >110 pairs of sister FISH signals from late S cells were analyzed. This assessment was completed once. Detailed statistical data are shown in Table S3.

