Figure 3.
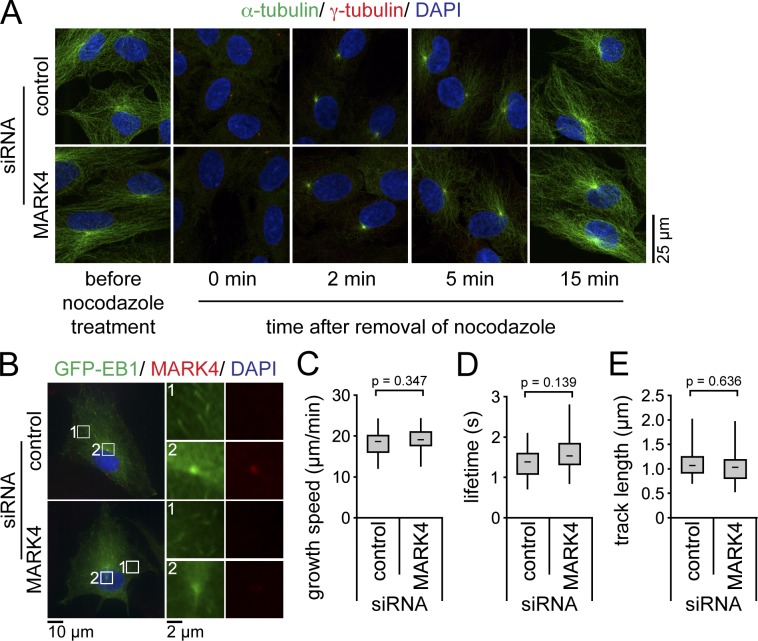
MARK4 depletion does not affect MT dynamics. (A) After control or MARK4 depletion, RPE1 cells were serum starved for 48 h and treated with 8 µM nocodazole at 37°C for 90 min to depolymerize MTs. Cells were stained for α- and γ-tubulin and DNA. (B–E) After control or MARK4 depletion, GFP-EB1–expressing RPE1 cells were serum starved for 24 h and either stained for MARK4 and DNA (B) or analyzed by live-cell imaging (Videos 1 and 2). The left images in B show merged images. Regions within the white boxes are depicted at higher magnification on the right showing GFP-EB1 tracks in the cytoplasm (1) or the centrosome (2). Time-lapse sequences were analyzed using automated tracking software. There is no significant difference in the mean growth speeds (C), lifetimes (D), and track lengths (E) between cells treated with control or MARK4 siRNA (control, n = 15; MARK4, n = 22). Boxes show the top and bottom quartiles (25–75%) with a line at the median, and whiskers extend from the minimum to the maximum of all data.

