Figure 4.
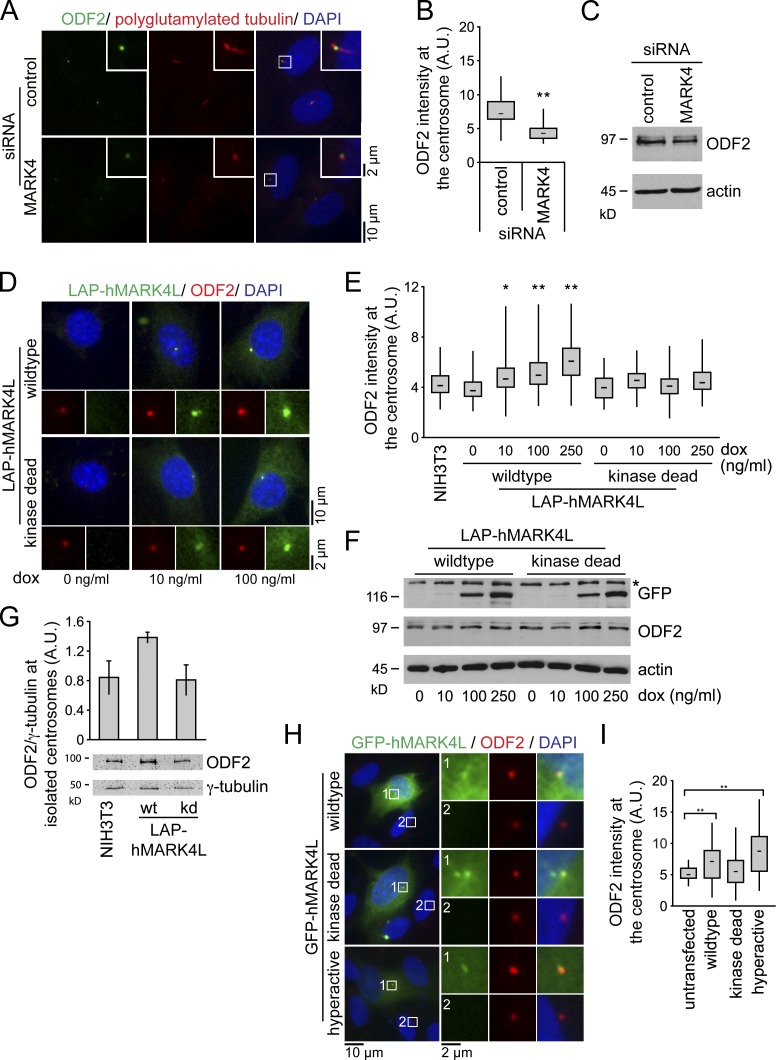
MARK4 regulates centrosomal localization of ODF2. (A) After control or MARK4 depletion, RPE1 cells were serum starved for 48 h and stained with the indicated antibodies. The right images show merged images. Insets show higher magnification of the regions within the white boxes. (B) Box and whisker plots show the relative ODF2 intensity at the centrosome after control and MARK4 depletion in RPE1 cells. One representative experiment out of three is shown. **, P < 0.001. A.U., arbitrary units. (C) Immunoblot analysis of the indicated RPE1 cell extracts using anti-ODF2 antibodies. Actin served as a loading control. (D) NIH 3T3 cells stably expressing either LAP-hMARK4L wild-type or kd mutant under the control of the TET-on promoter were treated with doxycycline (dox) and stained for ODF2 and DNA. The LAP tag enabled visualization of MARK4 constructs via a GFP moiety. (E) Box and whisker plots show the relative ODF2 intensity at the centrosome of untransfected cells (NIH 3T3) and cells expressing LAP-hMARK4L wild-type or kd mutant. One representative experiment out of three is shown. *, P < 0.05; **, P < 0.001 with respect to untransfected cells. (F) Immunoblot analysis of NIH 3T3 cells carrying the indicated constructs and treated with variable amounts of doxycycline as in D. ODF2 was detected with ODF2-specific antibodies. Anti-GFP antibodies were used to detect the LAP-hMARK4L constructs. Actin served as a loading control. The asterisk indicates an unspecific band. (G) Centrosomes from NIH 3T3 cells and NIH 3T3 cells expressing either LAP-hMARK4L wild-type (wt) or kinase-dead (kd) mutant were isolated by centrifugation using a discontinuous sucrose gradient and immunoblotted for ODF2 and γ-tubulin. The graph shows the quantification of centrosome-associated ODF2 normalized to γ-tubulin. Data are means ± SD of three independent experiments. (H) RPE1 cells were transiently transfected with the indicated constructs for 24 h, serum starved for 24 h, and stained for ODF2 and DNA. The left images show merged images. Regions within the white boxes are shown at a higher magnification to the right. (I) Box and whisker plots show the relative ODF2 fluorescence intensity at the centrosome in untransfected cells and after overexpression of the indicated constructs. One representative experiment out of three is shown. **, P < 0.001 with respect to untransfected cells. Boxes show the top and bottom quartiles (25–75%) with a line at the median, and whiskers extend from the minimum to the maximum of all data.

