Fig. 1.

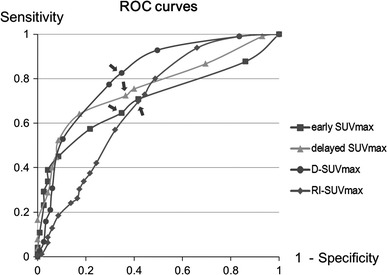
ROC analysis showed that the D-SUVmax provided a best statistical differentiation between ML and BLN. ROC analysis revealed that the proper cut-off values of early, delayed, D- and RI-SUVmax were 3.0, 4.0, 1.0 and 0.22, respectively (arrows)

ROC analysis showed that the D-SUVmax provided a best statistical differentiation between ML and BLN. ROC analysis revealed that the proper cut-off values of early, delayed, D- and RI-SUVmax were 3.0, 4.0, 1.0 and 0.22, respectively (arrows)