
Figure 1. Origins of 370A.
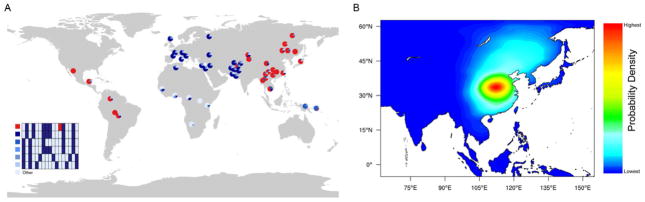
(A) Haplotype distribution of the genomic region surrounding V370A, based on 24 SNPs covering ~139 kb. The six most common haplotypes are shown, and the remaining low frequency haplotypes grouped as “Others”. The chimpanzee allele was assumed to be ancestral. Derived alleles are in black, except for the 370A variant which is red. (B) The approximate posterior probability density for the geographic origin of 370A obtained by ABC simulation. The heat map was generated using 2D kernel density estimation of the latitude and longitude coordinates from the top 5,000 (0.46%) of 1,083,966 simulations. Red color represents the highest probability, and blue the lowest. See also Figures S1–5, S7 and Tables S1–S4.