
Figure 1.
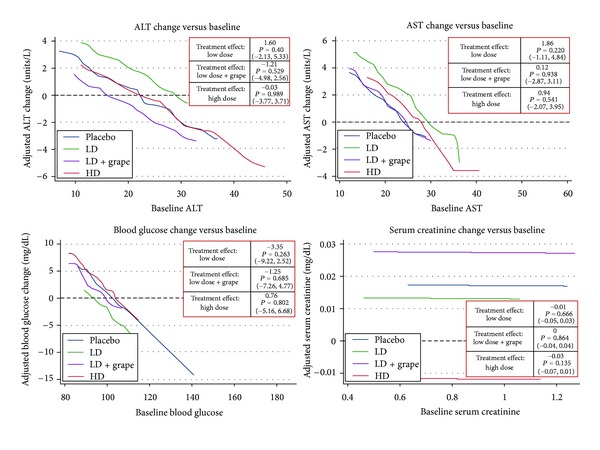
Primary safety analysis. Interpretation: expected Changes in an Outcome (vertical axis) for any given level of baseline value (horizontal axis) across all four treatment groups. Adjusted for age, gender, and race.
Official websites use .gov
A
.gov website belongs to an official
government organization in the United States.
Secure .gov websites use HTTPS
A lock (
) or https:// means you've safely
connected to the .gov website. Share sensitive
information only on official, secure websites.
Primary safety analysis. Interpretation: expected Changes in an Outcome (vertical axis) for any given level of baseline value (horizontal axis) across all four treatment groups. Adjusted for age, gender, and race.