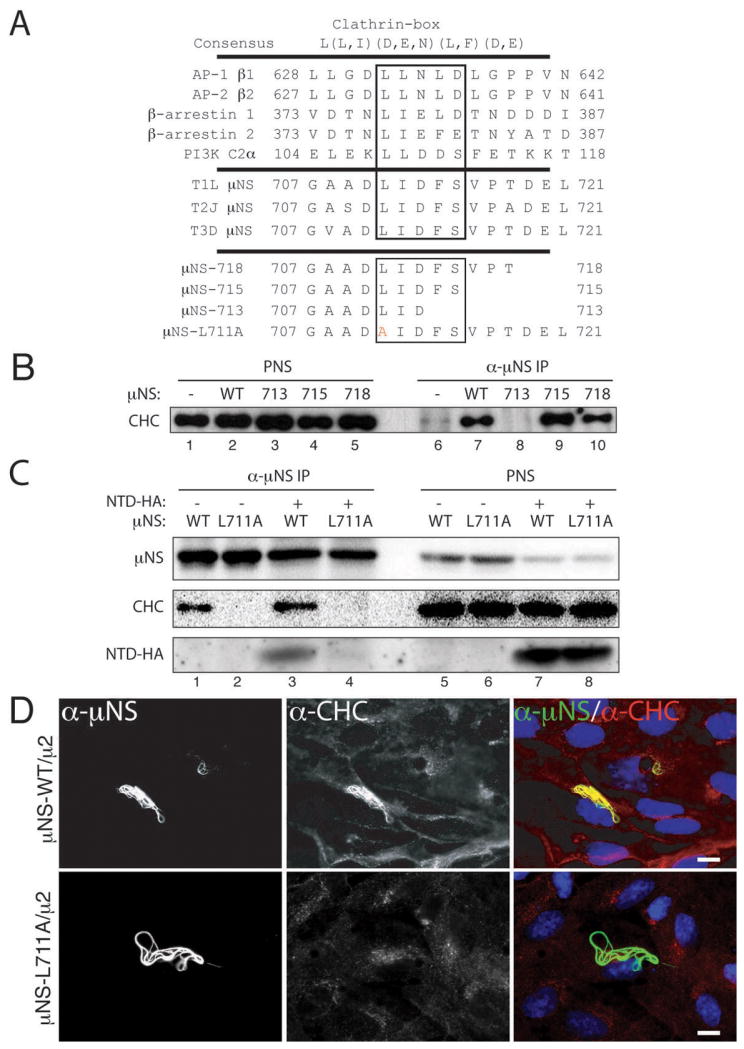
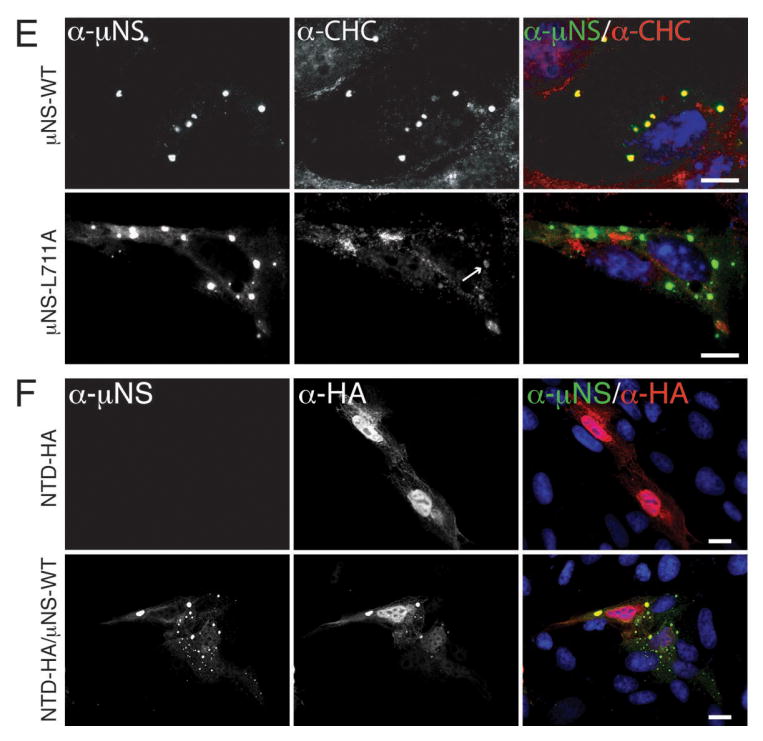
Figure 3. μNS contains a putative clathrin-binding motif required for clathrin recruitment to factory-matrix structures.


A) The following are shown: consensus clathrin-box motif; examples of proteins shown to contain functional clathrin-box motifs; C-terminal sequences of μN S of MRV strains T1L, T2J and T3D; and mutations engineered near the C-terminus of T1L μNS. Residues matching the clathrin-box consensus are boxed. Mutated residue in μNS-L711A is shown in red. B, C) μNS-WT or μNS-L711A was expressed alone (lanes 1, 2, 5 and 6) or in combination with NTD-HA (lanes 3, 4, 7 and 8) in CV-1 cells following plasmid transfection. Cells were harvested at 28 h p.t. and μNS was immunoprecipitated from postnuclear supernatants (PNS) using μNS-specific serum antibodies (α-μNS). Immunoprecipitated proteins (lanes 1 to 4) or proteins contained within PNS prior to immunoprecipitation (lanes 5 to 8) were detected by SDS/PAGE and immunoblotting using either μNS-specific serum antibodies (μNS) or MAb TD.1 (CHC) or a combination of MAb TD.1 and anti-HA (NTD-HA). D) μNS-WT or μNS-L711A was co-expressed with μ2 in CV-1 cells following plasmid transfection. At 38 h p.t., cellular localizations of μNS (α-μNS, left column) and clathrin HC (α-CHC, middle column) were visualized as in Figure 2. E) μNS-WT or μNS-L711A was expressed in CV-1 cells following plasmid transfection. At 24 h p.t., cellular localizations of μNS (α-μNS, left column) and clathrin HC (α-CHC, middle column) were visualized as in Figure 2. Arrow in the middle column points to residual staining for clathrin HC visible within one of the factory-matrix structures. F) μNS-WT and NTD-HA were co-expressed in CV-1 cells by plasmid-based transfection. At 24 h p.t., they were visualized by indirect IF microscopy using a combination of μNS-specific serum antibodies (α-μNS, left column) and MAb Mono HA.11 (α-HA, middle column). In D, E and F, merged images are shown at right (α-μNS, green; α-HA or α-CHC, red). Scale bars, 20 μm.
