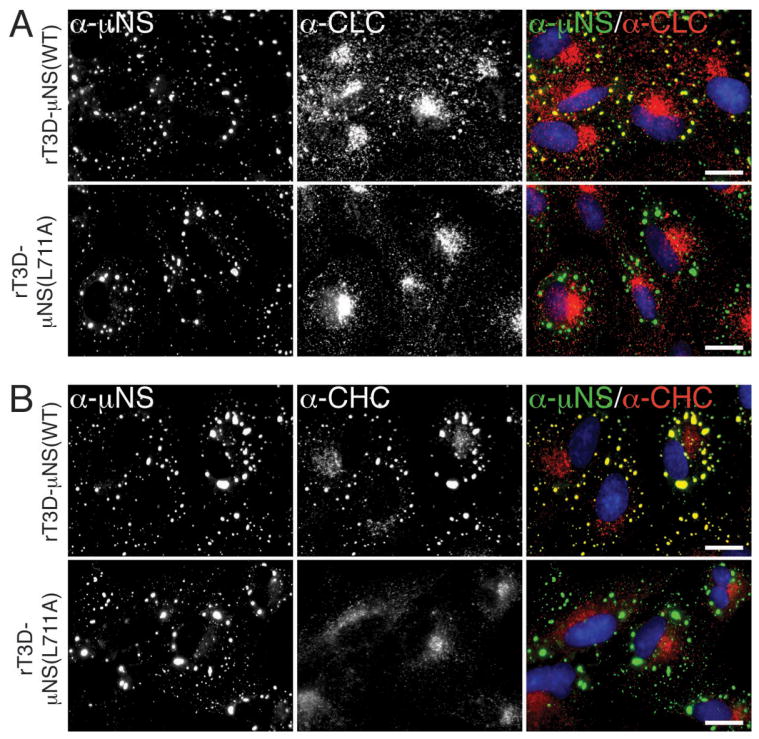
Figure 4. Clathrin recruitment to MRV factories is dispensable for their formation.

A, B) CV-1 cells were infected with second-passage stocks of rT3D-μNS(WT) or rT3D-μNS(L711A) at 5 PFU/cell. At 24 h p.i., cellular localizations of μNS (α-μNS, left column) and either clathrin LCA/B (α-CLC, middle column) (A) or clathrin HC (α-CHC, middle column) (B) were visualized as in Figure 2. In A and B, merged images are shown at right (α-μNS, green; α-CHC, red). Scale bars, 20 μm.
