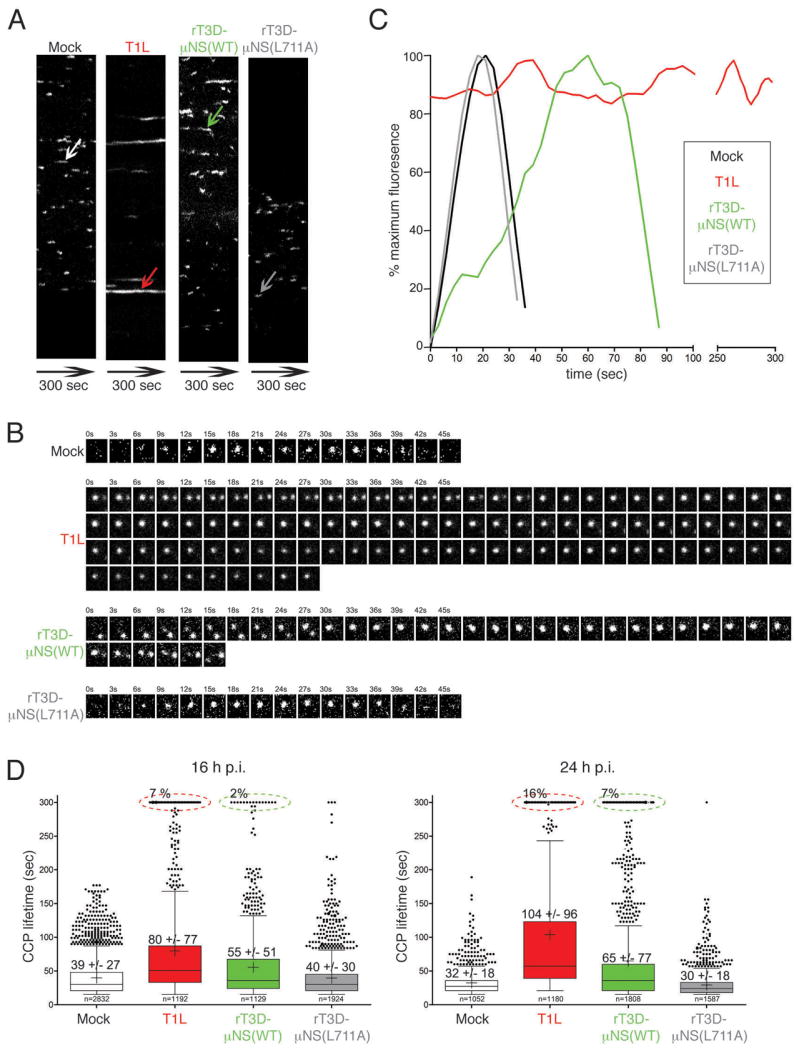
Figure 6. Sequestration of clathrin in MRV factories increases the lifetime of clathrin-coated pits.

BSC-1 cells stably expressing AP2(σ2)-GFP were mock-infected or infected with either T1L, rT3D-μNS(WT) or rT3D-μNS(L711A) MRV. 16 h p.i. dynamics of clathrin-coated pits was monitored in live cells by taking time-lapse images every 3 sec for the total of 300 sec by confocal microscopy. The CCPs were identified and tracked over time as described in Materials and Methods. A) Kymographs of mock- and MRV-infected cells showing AP2(σ2)-GFP fluorescence projected over time (X-axes). Each fluorescent trace in the X-axis represents an individual CCP forming and disassembling at the membrane of the imaged cell, and the length of the trace reflects the CCP lifetime. The arrows point to a representative CCP analyzed further in B and C. B) Tile view of a representative CCP (shown by arrow in A) forming in either mock-infected, T1L-, rT3D-μNS(WT)- and rT3D-μNS(L711A)-infected cell. C) Fluorescence-intensity profiles of AP2(σ2)-GFP recruitment to CCPs shown by tile view in B. Weighted averages of smoothed fluorescent time trajectories are shown in each case. Mock-infected, black line; T1L, red line; rT3D-μNS(WT), green line; rT3D-μNS(L711A), grey line. D) Box-and-whisker plot comparing CCP lifetimes in mock-, T1L-, rT3D-μNS(WT)- and rT3D-μNS(L711A)-infected cells either at 16 h p.i. (left) or at 24 h p.i. (right). The bottom and top boundaries of each box represent the 25th and the 75th percentile, respectively, defining the interquartile range (IQR) between them. The horizontal line in each box marks the median, and the cross marks the average CCP lifetime. The whiskers on either side of the boxes represent the lowest and the highest data value still within 1.5 IQR of the lower and the upper quartiles. The dots represent the values outside the range encompassed by the whiskers. At least 1000 CCPs derived from three different cells were analyzed for each sample. Circled events (dashed lines) represent arrested CCPs.
