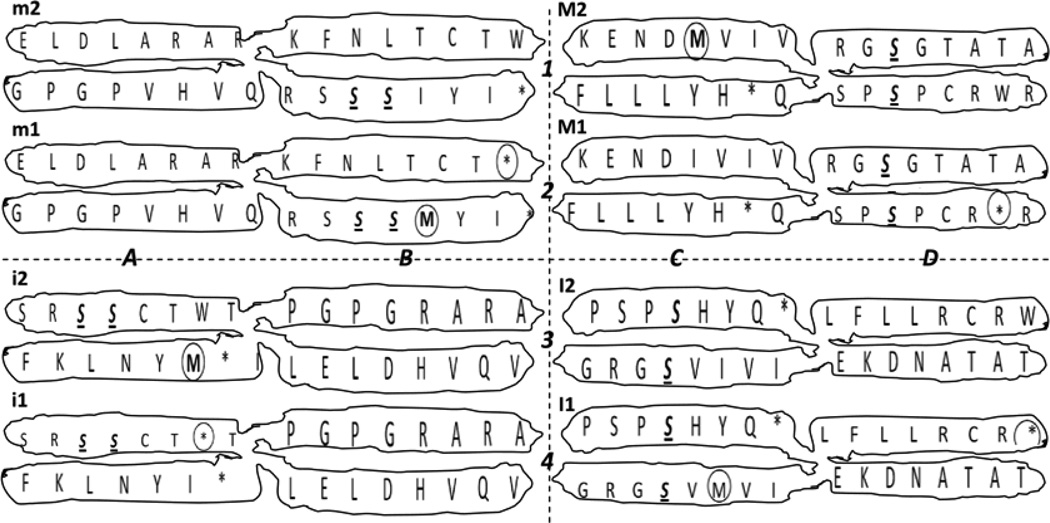
Figure 6.
Quasi-identical synthetic genetic code chromosomes obtained by defragging. Upper rows 1 and 2, left side: Chromosomes m (m1 and m2, obtained by the vertical view of the horizontal defragging shown in T. 2 of Figure 3) and, right side: M (M1 and M2, obtained by the vertical view of the vertical defragging shown in T. 1 of Figure 5). Lower rows 3 and 4, left side: Chromosomes i (i1 and i2, obtained by the vertical view of the horizontal defragging shown in T. 1 of Figure 3) and, right side: I (I1 and I2, obtained by the vertical view of the vertical defragging shown in T. 2 of Figure 5). Note: the single-codon self-annealed Ser, S, always fell in the same relative position of both of the chromatids per chromosome, being indicated in italics, bold and underlined, while the odd or uneven functional codons for the start (ATG, M) and for the end (TGA, *) are noticed by a small dotted circle. Each pair of chromosomes is the complete representation of the genetic code, so we have here half or four of its alternate genetic code chromosomal representations.

