
Fig. 2. Internal work (from potential and kinetic energy) in the segments (A) and summed for a limb (B) for the mean individual (individual 10) in the mean population (population 1) and in the population with mean crural index, but +3 standard deviation circumferences (population 2).
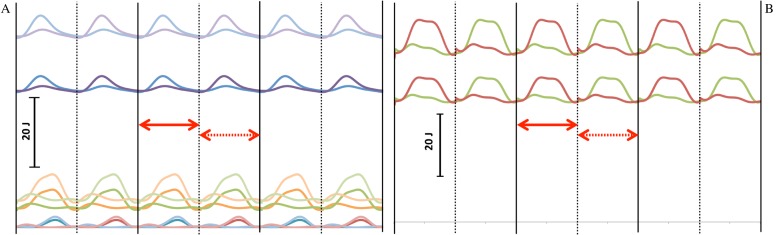
Three strides are shown; heelstrike for the right leg is shown with the solid black vertical line and for the left with a dashed black vertical line. The interval over which the analysis was done (first step of second stride) is indicated with a solid red double-headed arrow. The interval that was used to check the analysis (the second step of the second stride) is indicated with a dashed double-headed arrow. In A, the upper curves are for the thigh, the middle curves for the calf, and the lower curves are for the foot. Darker shades are population 1 while lighter shades are population 2. In B, the sum of the energies of the left (rust) and right (green) lower limbs are shown. The lower set of curves is for population 1, while upper set is population 2.