
Fig. 2. FISH reveals spatiotemporal patterns of Pa-Wnt1, Pa-cad and Pa-en.
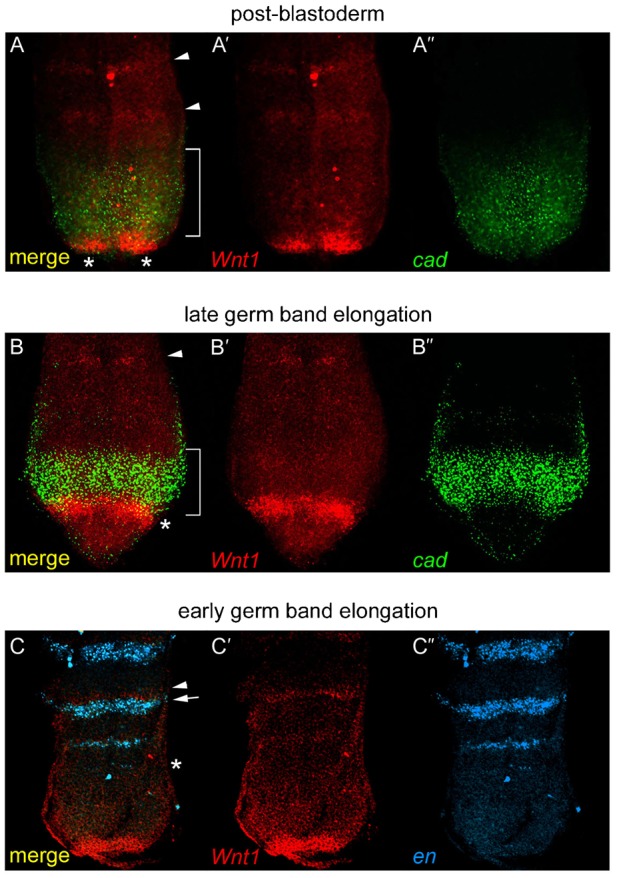
(A–A″) Posterior end of a post-blastoderm embryo (stage 6) showing Pa-Wnt1 (red, A′) and Pa-cad (green, A″) patterns. Pa-Wnt1 expression in segmental stripes (arrowheads), and posterior clusters (*) overlapping with Pa-cad domain (bracket). (B–B″) Posterior end of a germ band elongation embryo (stage 9), showing Pa-Wnt1 expression (B′) in segmental stripes in anterior GZ (arrowhead) and a posterior arc (*) slightly overlapping with Pa-cad (B″, bracket). (C–C″) Pa-Wnt1 (C′) and Pa-en (blue, C″) in the anterior GZ with stripes of Pa-en (*) developing before Wnt1 and defining the parasegment boundary. Pa-Wnt1 (arrowhead) is expressed anterior and adjacent to Pa-en (arrow).