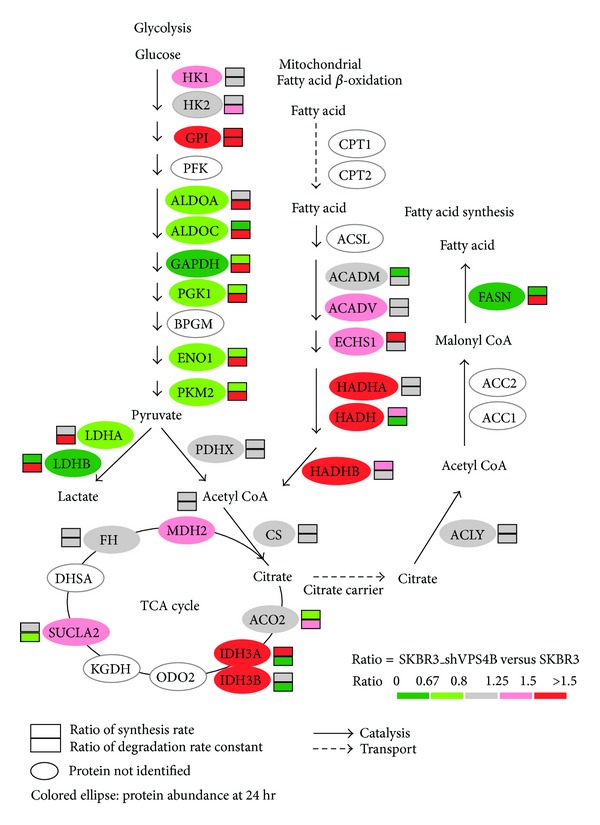
Figure 4.

VPS4B downregulation increases the expression of mitochondrial fatty acid β-oxidation related proteins and down regulates the expression of glycolysis related proteins in SKBR3 cells. The energy metabolism pathway was adapted from the Kyoto Encyclopedia of Genes and Genomes (KEGG) [40]. Colors represent the ratios of relative protein abundance at 24 hr (shaded ellipses), protein synthesis rate (shaded upper rectangles), and protein degradation rate constant (shaded lower rectangles) in SKBR3_shVPS4B versus SKBR3 cells. Red color represents protein with increased expression and green color represents protein with decreased expression.
