Figure 3.

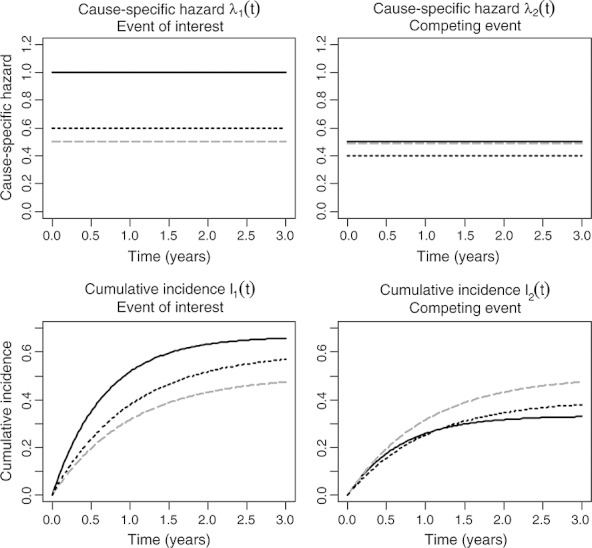
Hypothetical three-arm trial with a competing risks outcome. The top two panels show the assumed cause-specific hazards for placebo (solid black lines) and treatment 1 (dashed gray lines), which affects only the cause-specific hazard of the event of interest and treatment 2 (dotted black lines), which affects both cause-specific hazards. The two bottom panels show the resulting cumulative incidence functions.
