Fig. 2.
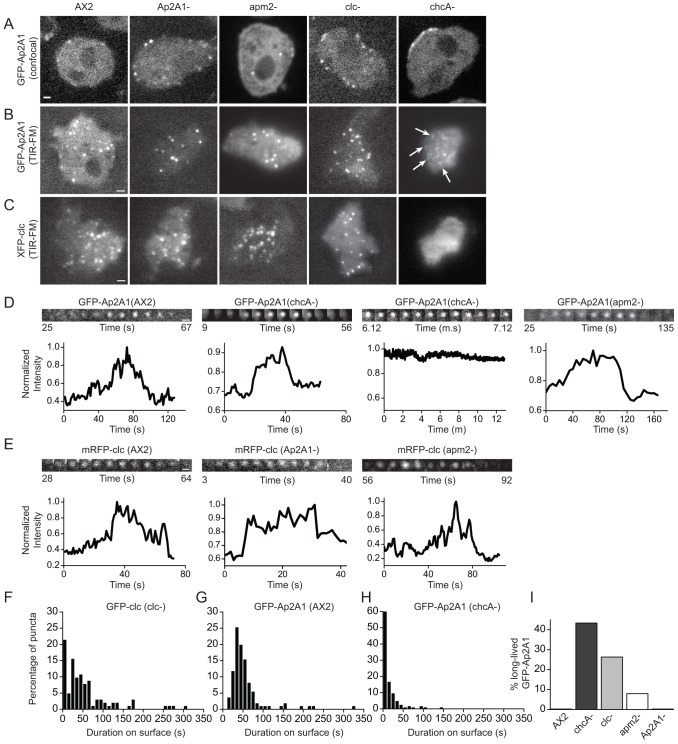
Intracellular localization and dynamics of clathrin and AP2. (A) Confocal sections showing the intracellular localization of GFP-Ap2A1 in wild-type (AX2), Ap2A1–, apm2–, clc– and chcA– cells. (B) TIR-FM images of GFP-Ap2A1 puncta in AX2, Ap2A1–, apm2–, clc– and chcA– cells. (C) TIR-FM images of mRFP-clc puncta in AX2, Ap2A1–, apm2–, chcA– and GFP-clc puncta in clc– cells. (D) Examples of the dynamics of individual GFP-Ap2A1 puncta imaged by TIR-FM in AX2, chcA– and apm2– cells. Normalized fluorescence intensity is plotted as a function of time for each punctum. (E) Examples of the dynamics of individual mRFP-clc puncta imaged by TIR-FM in AX2, Ap2A1– and apm2– cells. Normalized fluorescence intensity is plotted as a function of time for each punctum. (F–H) Cell surface duration of (F) GFP-clc puncta in clc– cells; (G) GFP-Ap2A1 puncta in AX2 cells; and (H) GFP-Ap2A1 in chcA– cells. (I) Percentage of GFP-Ap2A1 puncta present at the end of the time-lapse with durations >350 seconds. Scale bars: 1 µm (A–C); 0.5 µm (D,E). See also supplementary material Fig. S1 and Table S3.

