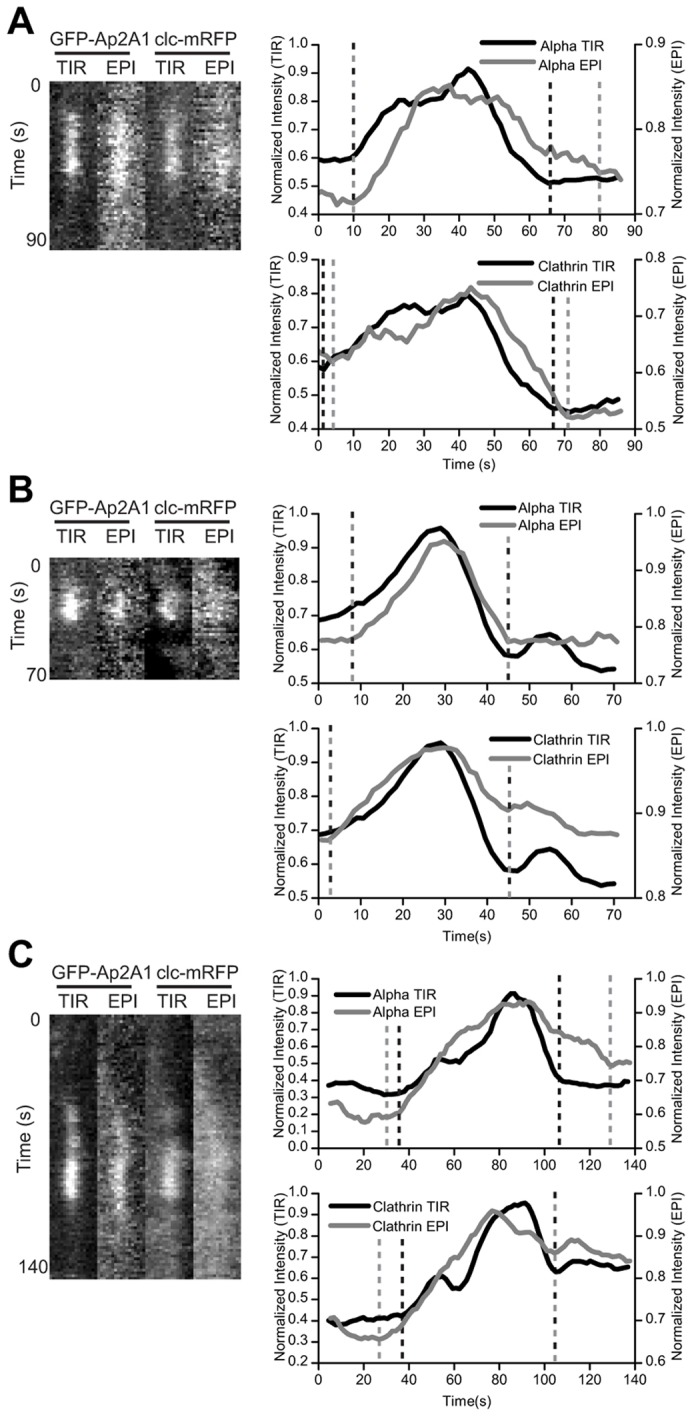
Fig. 4.

Identification of internalizing puncta. Examples of the dynamics of individual GFP-Ap2A1 and clc-mRFP puncta imaged by two-color alternating EPI and TIR illumination. Kymographs are a maximum intensity projection of the four pixels surrounding the center of the punctum. Normalized fluorescence intensity is plotted as a function of time for GFP-Ap2A1 TIR signal (top graph, black line), GFP-Ap2A1 EPI signal (top graph, gray line), clc-mRFP TIR signal (bottom graph, black line) and clc-mRFP EPI signal (bottom graph, gray line). Lines indicate the time of either appearance or disappearance for each channel. (A) An individual punctum where the EPI and TIR signals appear together and the TIR signal disappears before the EPI signal. (B) An individual punctum where the EPI and TIR signals appear and disappear together. (C) An individual punctum where the EPI signal appears before the TIR signal.
