
Fig. 5.
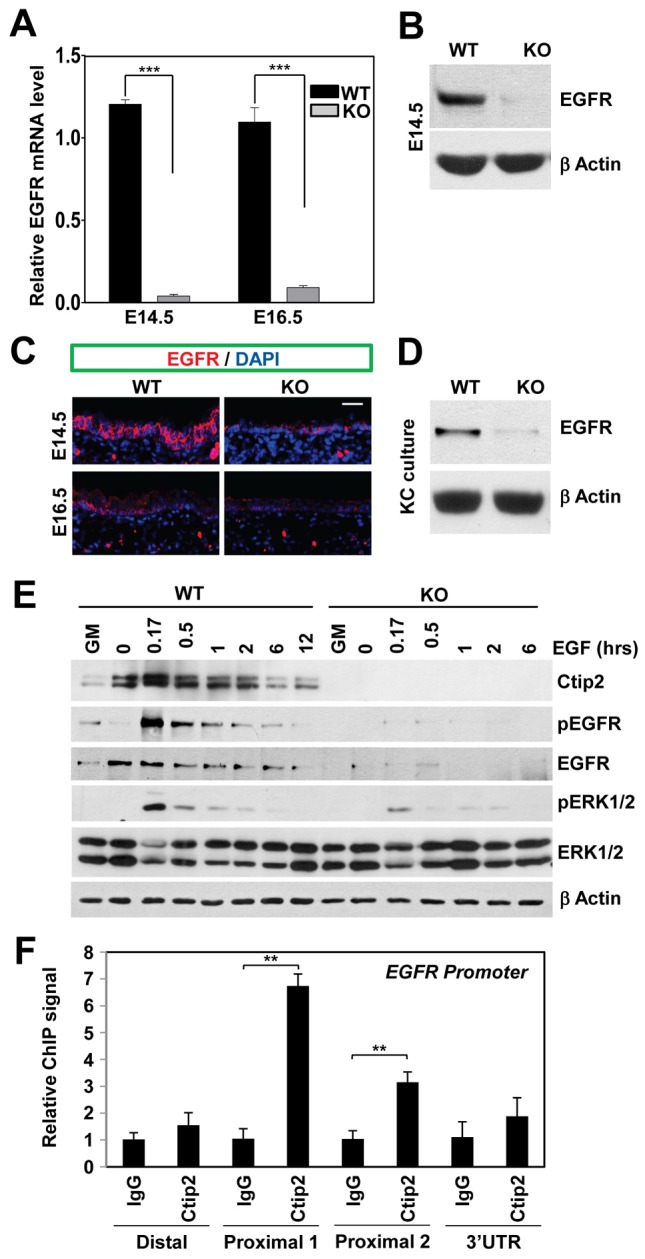
Ctip2 modulates EGF signaling by positively regulating EGFR expression. (A) E14.5 and E16.5 embryonic skin was harvested from WT and KO embryos for RT-qPCR analyses (normalized to GAPDH). Bars represent mean expression levels ± s.e.m. (n = 3). (B) Immunoblotting analyses of cell extracts from E14.5 skin using anti-EGFR and β-actin antibodies. (C) Immunofluorescence staining of E14.5 and E16.5 skin sections with anti-EGFR antibody (red); nuclei were counterstained with DAPI (blue). Scale bar: 10 µm. (D) Immunoblot of epidermis from E18.5 WT and KO skin using anti-EGFR antibody. β-actin blot is a loading control. (E) Keratinocytes cultured under growth (GM) conditions were starved overnight, treated with 10 ng/ml EGF for the indicated time before harvesting for immunoblotting analyses using the indicated antibodies. β-actin, loading control. (F) Epidermal keratinocytes from E16.5 WT embryos were subjected to ChIP analyses using an anti-Ctip2 antibody and IgG as a control. Purified chromatin was then analyzed by qPCR using primers covering either the distal or proximal promoters or 3×UTR (untranslated regions) of the EGFR gene. Each bar represents the ChIP signals using anti-Ctip2 relative to signals from non-specific IgG. Statistical analyses were performed using a Student's t-test (**P<0.01). The results are representative of at least three independent studies.