
Fig. 7.
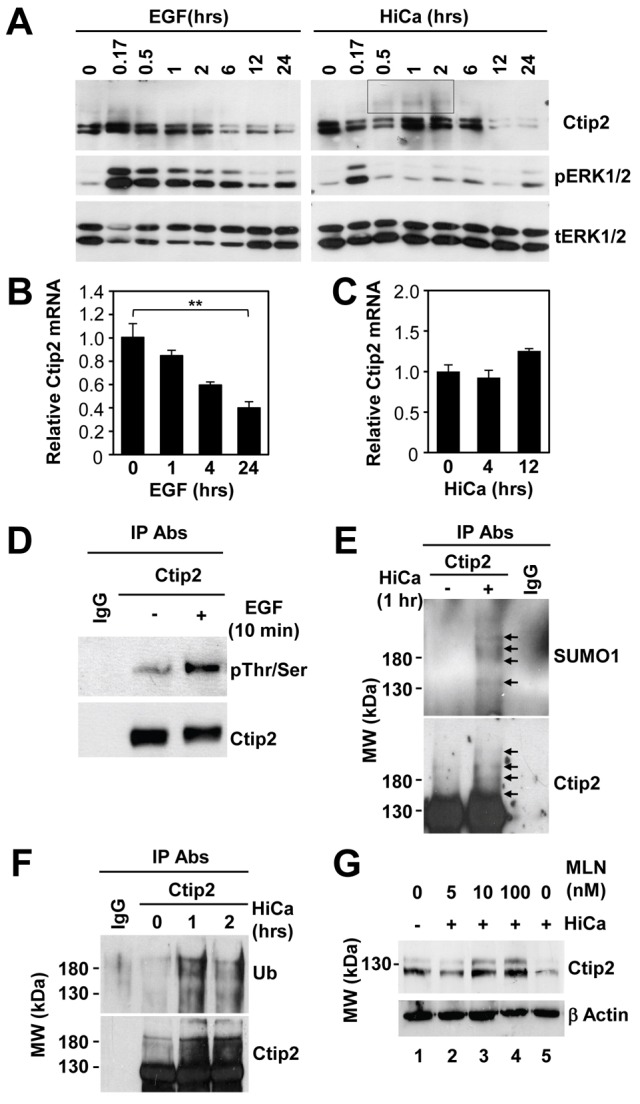
Differential regulation of Ctip2 levels in keratinocytes by EGF and calcium signaling pathways. (A) Starved WT mouse keratinocytes were treated with 10 ng/ml EGF (left panel) or 0.2 mM CaCl2 (right panel) for the indicated times before immunoblotting analyses using antibodies against Ctip2, phospho-ERK or total ERK. (B,C) Starved WT keratinocytes were treated with either 10 ng/ml EGF (B) or 0.2 mM CaCl2 (HiCa; C) for the indicated time before RT-qPCR analyses of Ctip2 mRNA levels (normalized to GAPDH). Results are shown as means ± s.e.m. (n = 3; **P<0.001). (D) Primary mouse keratinocytes transfected with FLAG-Ctip2 were treated with 10 ng/ml EGF or left untreated for 10 min before immunoprecipitation (IP) analyses using Ctip2 antibody or IgG as control. The immunoprecipitates were probed with an anti-phospho-serine/threonine antibody (the upper blot). The blot was stripped and reprobed with the anti-Ctip2 antibody (the lower blot). Note that phosphorylation caused a small reduction in the electrophoretic mobility of Ctip2 on SDS-PAGE; see also 10 min (0.17 hr) time-point in A. (E,F) Primary keratinocytes transfected with FLAG-Ctip2 were treated with high calcium (HiCa) or left untreated for the indicated times before IP analyses (as above). Immunoprecipitates were probed with an anti-SUMO1 antibody to detect SUMOylated Ctip2 (E, the upper blot) or anti-ubiquitin antibody to detect ubiquitinated Ctip2 (F, the upper blot). The blots were then stripped and reprobed with the anti-Ctip2 antibody (the lower blots). (G) Starved WT keratinocytes were left untreated (lane 1) or were treated with high calcium (lanes 2–5) in presence of the indicated amount of proteasome inhibitor MLN2238 (lane 2–4) for 12 hrs. Cells were then subjected to immunoblotting analyses using anti-Ctip2 antibody. β-Actin, loading control. All experiments were performed in triplicate.