
Fig. 2.
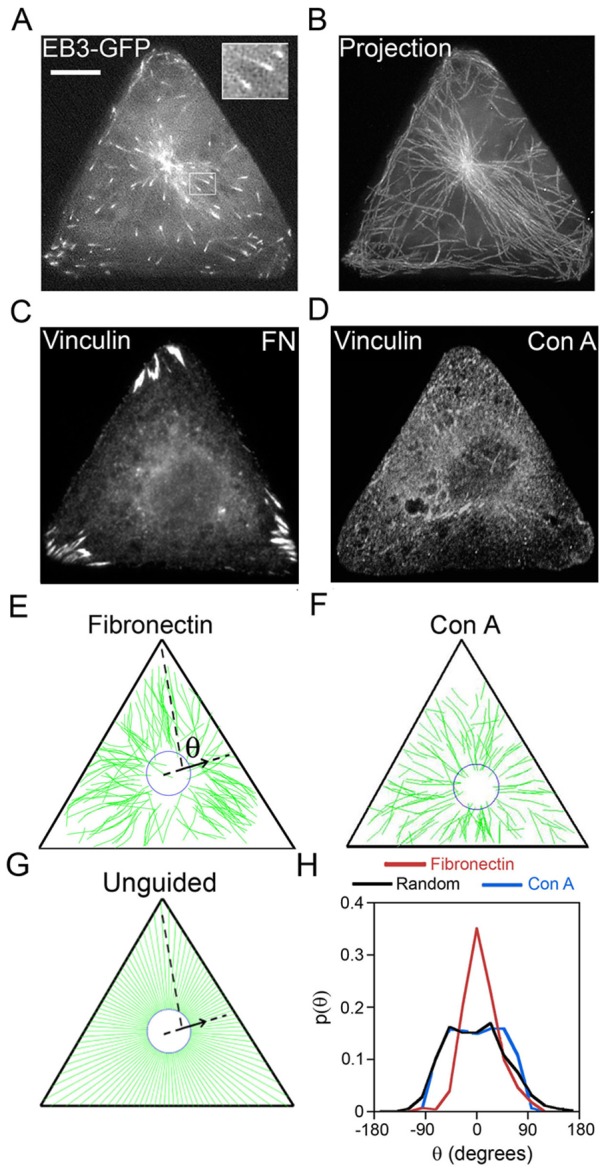
MT growth is guided towards focal adhesions located at the vertices of triangular cells. MT growth trajectories were reconstructed from time-lapse imaging of MT plus-end protein EB3–GFP in triangular Rat2 cells. (A) A single frame from a time-lapse movie of EB3–GFP dynamics (see also supplementary material Movie 1). Large, bright accumulation of EB3–GFP at the cell center marks the centrosome from which new MTs are nucleated. Small, comet-shaped EB3–GFP spots (see also enlarged inset in the top-right corner) mark growing plus ends of MTs. This comet shape makes it easy to identify the direction of movement and MT growth at any given time. (B) Reconstruction of representative MT growth trajectories by superposition of multiple (∼50) consecutive frames (total time, 150 sec). (C) FAs marked by vinculin are located exclusively at the vertices of the triangular cells plated on fibronectin. (D) Focal adhesions in cells plated on Con A are delocalized or cannot be discerned. Scale bar: 10 µm (A–D). (E) Example of reconstruction of all MT growth trajectories for a cell plated on fibronectin (shown in green) from one time-lapse movie of EB3–GFP dynamics (total time of observation for each cell was 5 min; image acquisition: one frame per 3 sec) by using house-written image recognition software. The arrow shows a vector parallel to the line joining EB3–GFP positions at two consecutive times; this vector corresponds to the direction of MT growth at a given time. The angle (θ) defined with respect to the nearest vertex of the triangle, is the angle by which the direction of growth of each MT at any given time deviates from its target (here, the vertex). (F) Reconstructed tracks for cells plated on Con A. (G) MT growth trajectories obtained computationally for the putative unguided case, whereby MTs grow radially outwards. (H) Normalized histograms/probability distributions of angles θ for experimental MT trajectories (red, on a fibronectin substrate; blue, on Con A, substrate; ∼500 MT growth trajectories in four cells for each substrate) and for the computationally generated, random/unguided (black) MT trajectories. On fibronectin, the spiked distribution indicates guided growth. On Con A, which promotes FA-independent adhesion, MT growth directions are unguided and very similar to computationally obtained random/unguided P(θ) distribution. A two-sample t-test shows that for cells on fibronectin substrate the probability (at θ = 0°) is greater than that for the random/unguided case at a 99% confidence level. In contrast, the probabilities for random/unguided case and for cells on Con A are statistically similar.