
Fig. 4.
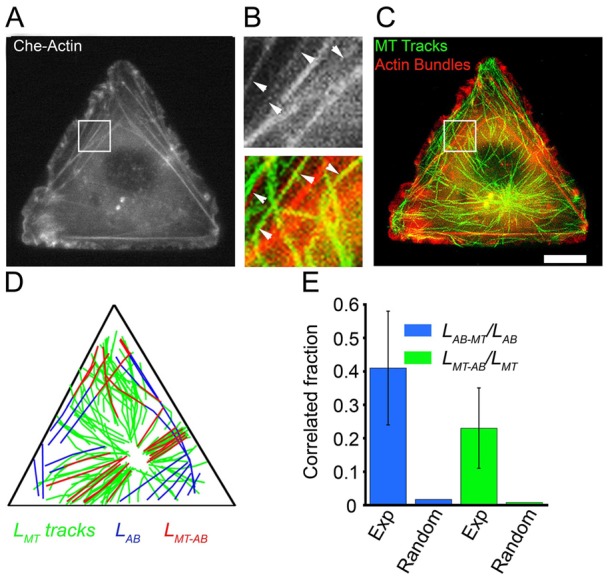
Cell-wide correlation of F-actin bundles and MT growth trajectories. (A–C) Dual-color time-lapse imaging of (A,C) mCherry–actin and (C) EB3–GFP (MT tracks from projection of ∼50 frames of EB3–GFP, shown in green, and merged with the F-actin image in red) in a triangular Rat2 cell. B shows enlarged images of the boxed regions in A and C (see also supplementary material Movies 1, 2). Scale bar: 10 µm (A,C). (D) Representative map of aligned, reconstructed F-actin bundles and MT growth trajectories (all actin bundles and MT growth trajectories in one cell are shown). Blue: F-actin bundles (ABs); green: MT growth trajectories/tracks (MT); red: F-actin bundles colocalized with MT growth trajectories (MT-AB). (E) Quantitative analysis of the colocalization of F-actin bundles and MT growth trajectories (Exp, experimental; Random, modeled random case; see main text for more details). A two-sample t-test shows that the experimental LMT-AB/LMT and LAB-MT/LAB values are greater than those of the simulated random case at the 99% confidence level.