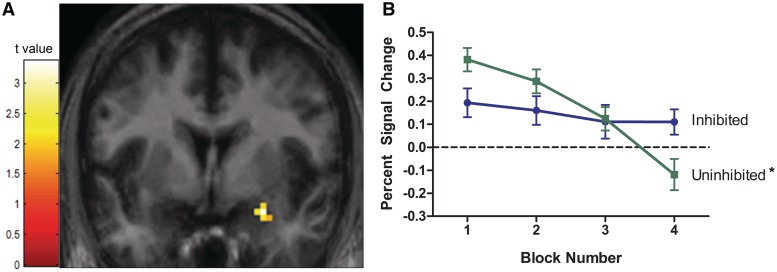
Fig. 2.
Amygdala BOLD response fails to habituate in individuals with an inhibited temperament. (A) The two temperament groups had different rates of habituation in a cluster of 15 voxels in the right amygdala (peak voxel: x = 27, y = −3, z = −21; z-score = 3.12, P = 0.001). (B) In the uninhibited group, amygdala BOLD response habituated as expected (*P < 0.05). However, in the inhibited group, amygdala BOLD response failed to habituate. The activation maps are superimposed on coronal slices of an average participant brain thresholded at P < 0.05 and 11 voxels. Line graphs show average percent signal change values (relative to baseline) for each block of faces by temperament group. Vertical lines represent standard error or the mean.

