
Figure 1. Plot of part of the exome data for the proband, with known dbSNP loci variant calls (heterozygous in clear circles, homozygous variant in filled circles) plotted to identify autozygous regions.
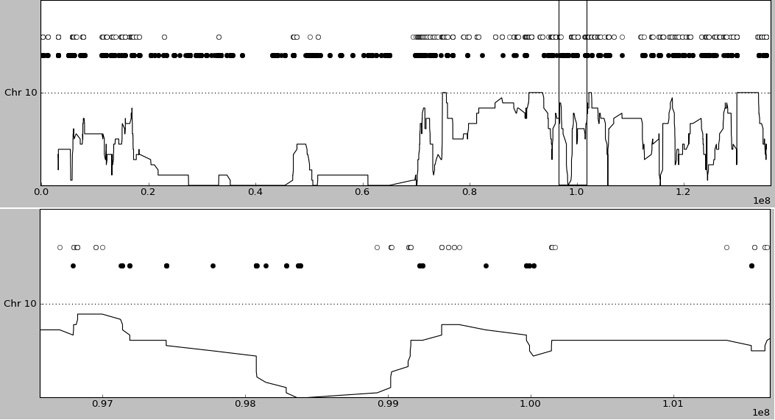
The lower line gives a rolling window average of homozygosity. Upper panel - all of chromosome 10 (~135Mb), note the very large (50Mb) region which is almost entirely homozygous. This reflects autozygosity and the two single isolated heterozygous calls are likely erroneous calls. Lower panel is a zoom of the ~5Mb region marked by vertical bars in the upper panel - note the 2Mb region of homozygosity, likely autozygosity, in the left half of the panel.