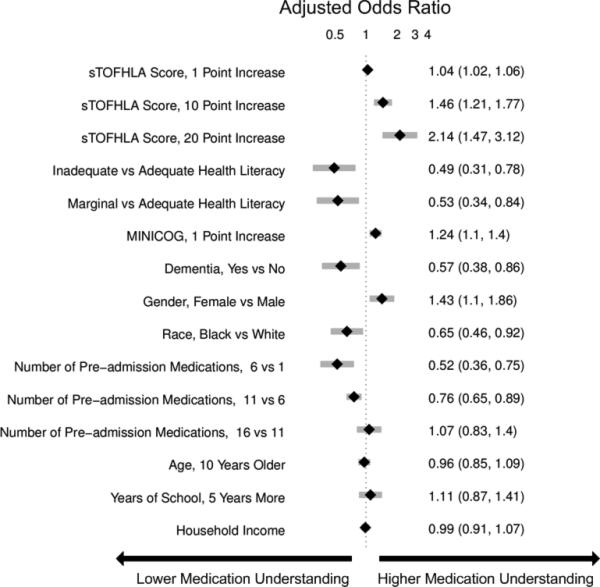
Figure 2.

Forest plot of the adjusted odds of a higher MUQ score compared to an average patient. *Odds Ratios (OR) of less than 1 represent lower medication understanding. OR of greater than 1 represent higher medication understanding. Model includes: age, gender, patient self reported race, s-TOFHLA score, cognitive function, primary language, years of education, number of pre-admission medications (non linear restricted cubic spline with 3 knots), income, insurance type, and study site. Diamonds represent point estimate and shaded gray bars represent 95% confidence intervals.
