
Fig. 1.
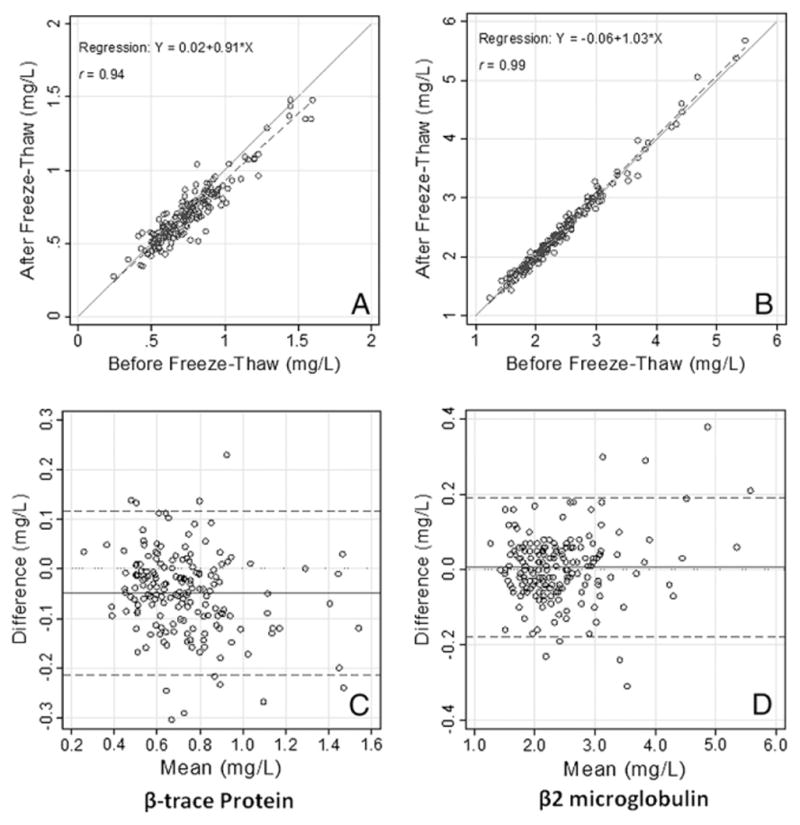
(A and B) Scatterplots comparing concentrations of βTP or β2M before and after a single freeze–thaw cycle. The solid line is the 45° line of identity (y=x). The dashed line is the Deming regression line. (C and D) Bland–Altman plots of the differences in concentrations of βTP or β2M before and after freeze–thaw versus the mean. The solid line is the mean difference, the dashed lines represent ±2 standard deviations.