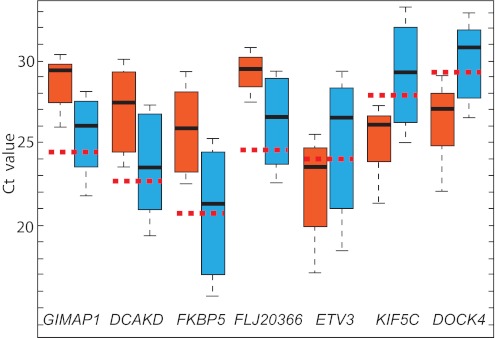
Figure 5.

Evaluation of GIMPA1, DCAKD, FKBP5, FLJ20366, ETV3, KIF5C, and DOCK4 gene expression in 6 FHL patients who relapsed (red box) and 15 patients with FHL who did not relapse during the study period (blue box). The vertical lines indicate the minimum and maximum of all of the data; the horizontal boundaries of the boxes the first and the third quartile of data; the thick black lines in the middle of the boxes the median of the data; and the red dotted line the median Ct of controls.
