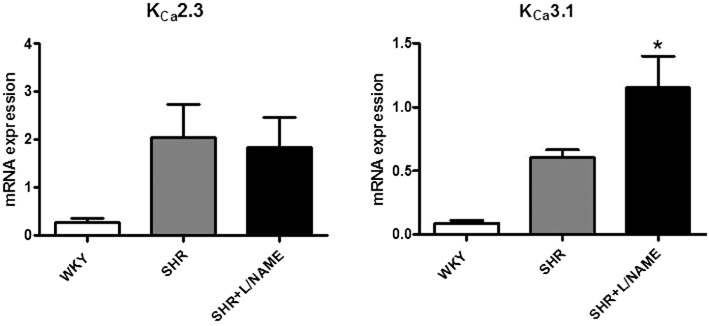
Figure 7.

Quantitative RT-PCR for mRNA for KCa2.3 and KCa3.1 protein in kidneys of WKY, SHR and L-NAME-treated SHR (n= 8–13). The values are normalized to the geometric mean of the values obtained with three internal controls: HPRT, β-actin and GAPDH. Values are expressed as mean ± SEM. *P < 0.05, significant difference between L-NAME-treated SHR and WKY kidneys; one-way anova-1 followed by a Bonferroni post hoc test, three multiple comparisons.
