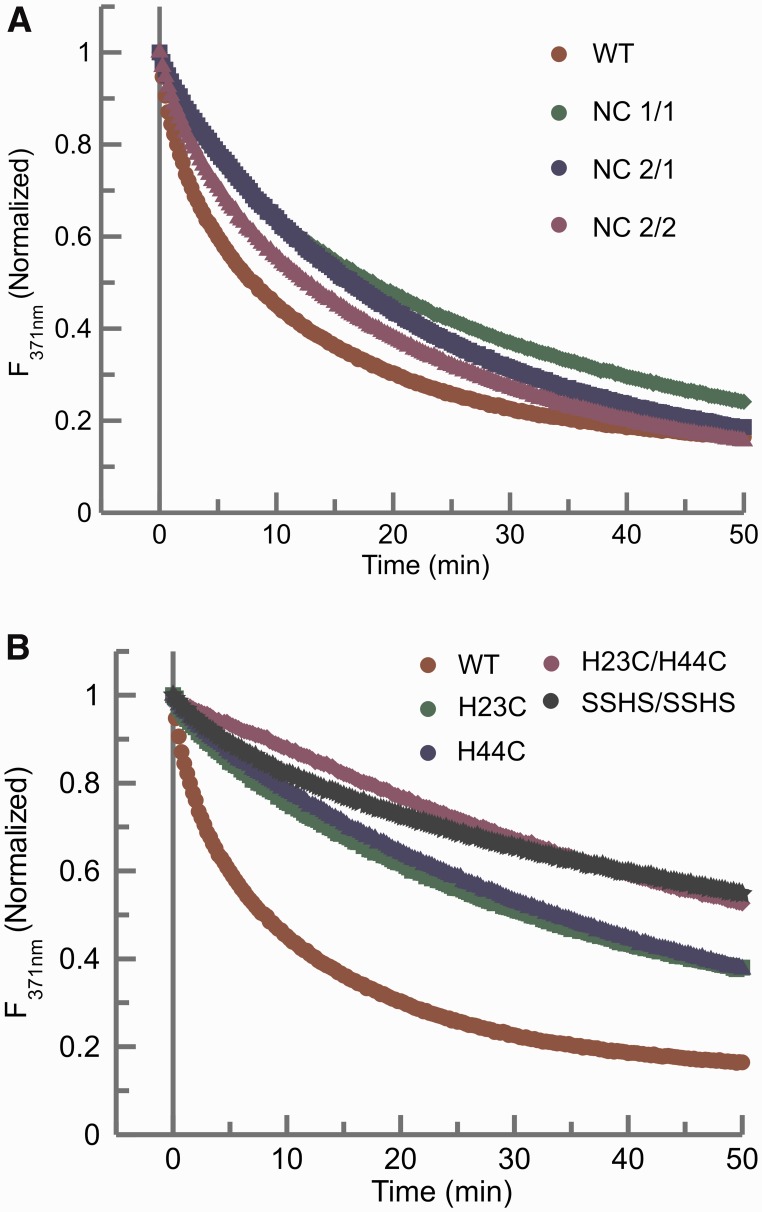
Figure 2.
(A) Comparison of the time dependent 2-AP fluorescence emission quenching plots of the wild-type NCp7 and the Zn finger positional variants of NCp7 (Table 1). NC 1/1 (green); NC 2/2 (purple); NC 2/1 (blue). (B) Comparison of the time dependent 2-AP fluorescence emission quenching plots of the wild-type NCp7 and the Zn finger coordination variants of NCp7: H23C (green), H44C (blue) and H23C/H44C (purple), and SSHS/SSHS (black). In both panels, the NCp7 wild-type curve (red) is plotted as a reference for comparison. In each of these assays, 225 nM of the mutant NCp7 protein was added to 100 nM of RNA kissing complex. The 2-AP quenching curves were fit to an exponential equation to obtain the rates of conversion of kissing complex to extended duplex (Table 2).

