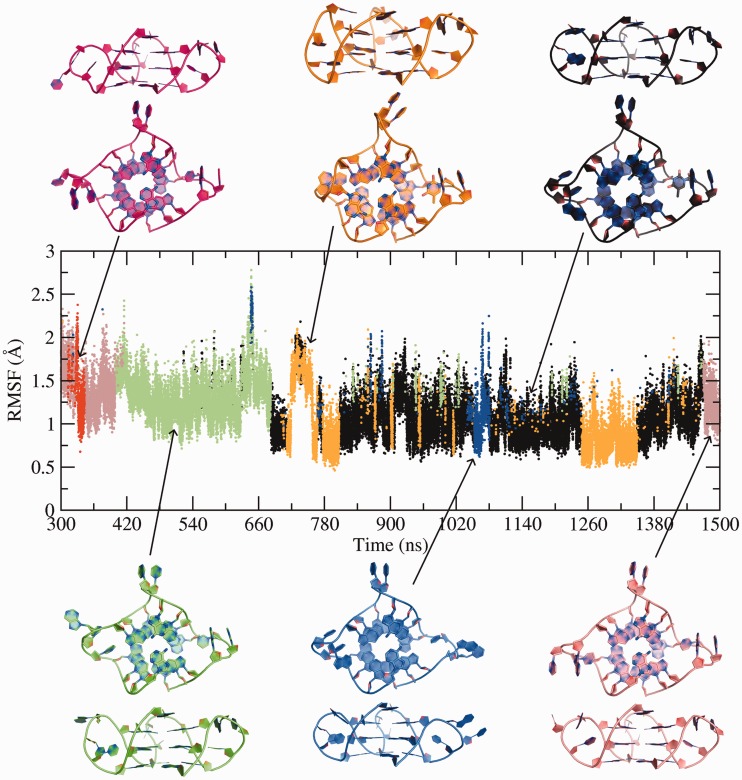
Figure 7.
Ensemble of conformations identified via clustering analysis. RMSD-based clustering, with a cut-off of 3.0 Å, over equilibriated trajectory identified six clusters. Cartoon representations of top and side view of cluster centres are illustrated. The orange and blue clusters are transitional substates observed within the black cluster, whereas the red cluster appears within the pink cluster.

