Figure 3.
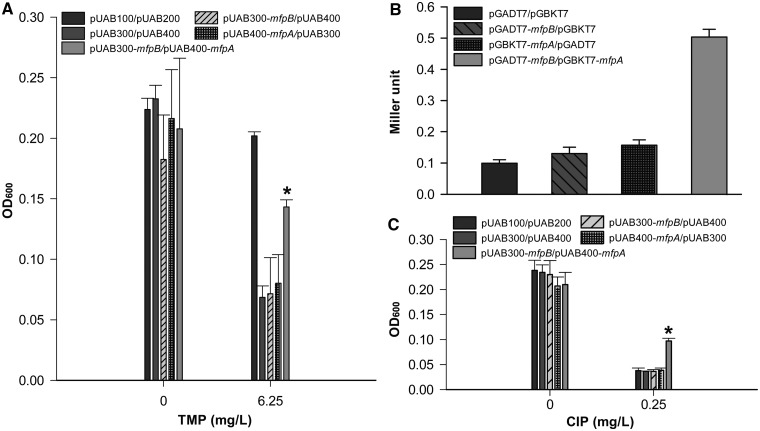
MfpB interacts with MfpA. (A) M-PFC analysis demonstrated that MfpB associates with MfpA. M. smegmatis cells were co-transformed with M-PFC plasmid pairs pUAB100 and pUAB200 as a positive control. Cells harboring plasmid pairs pUAB300 and pUAB400, pUAB300-mfpB and pUAB400, pUAB400-mfpA and pUAB300 were negative controls. The bacterial strain containing pUAB300-mfpB and pUAB400-mfpA was used to detect the interaction between MfpA and MfpB. Bacteria were cultured on 7H9 medium with 6.25 mg/l of TMP. Growth is indicative of protein–protein associations as measured by OD600. (B) Y2H analysis indicates that MfpB interacts with MfpA. Yeast cells were co-transformed with the plasmid pairs pGBKT7 and pGADT7, pGADT7-mfpB and pGBKT7, pGBKT7-mfpA and pGADT7, pGADT7-mfpB and pGBKT7-mfpA, respectively. Quantitative LacZ assays were used to quantitatively test the interaction of MfpB and MfpA. (C) The interaction of MfpB and MfpA confers resistance to CIP. Cultures were treated with 0 or 0.25 mg/l of CIP. Growth is indicative of loss of susceptibility to CIP as measured by OD600. Data shown are means ± standard deviations (SD) from four independent experiments (*P < 0.05).

