Figure 1.
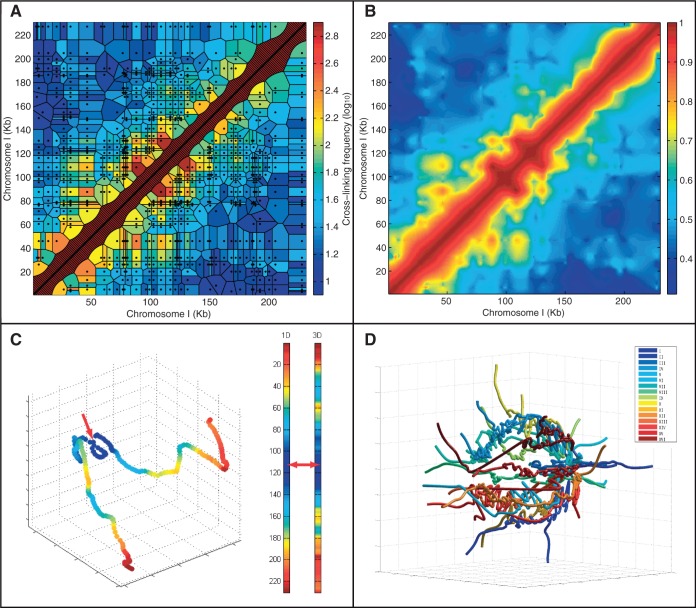
Studying genome structure using 3C at 1-kb interpolated resolution. (A) 3C data for the S. cerevisiae chromosome I superimposed on the estimated chromosomal relationships (tessellation cells) they represent. Black dots represent pairs of restriction fragment mid-points with evidence of cross-linking. Cell color indicates the observed frequency (effectively identical to a nearest neighbor interpolant). The diagonal areas are artificially inserted to overcome inherent lack of self-contacts in the method (see also Supplementary Figure S3). (B) Natural neighbor interpolation of the 3C data at 1-kb resolution. The colors indicate the likelihood of proximity of the genomic loci. (C) A 3D model of chromosome I generated using non-linear dimensionally reduction on the interpolated dataset shown in B. Color indicates proximity to the mid-point of the chromosome—marked with a red arrow. Note that the distance is not equivalent to the distance on the primary sequence (indicated by the left color bar) as the shape projects inwards. (D) A model of the yeast genome by non-linear dimensionally reduction as in C but extended to all chromosomes by sampling (see ‘Materials and Methods’ section). Note that the chromosomes lie at the periphery in a spherical fashion with the ends extended and centromeres joined.

