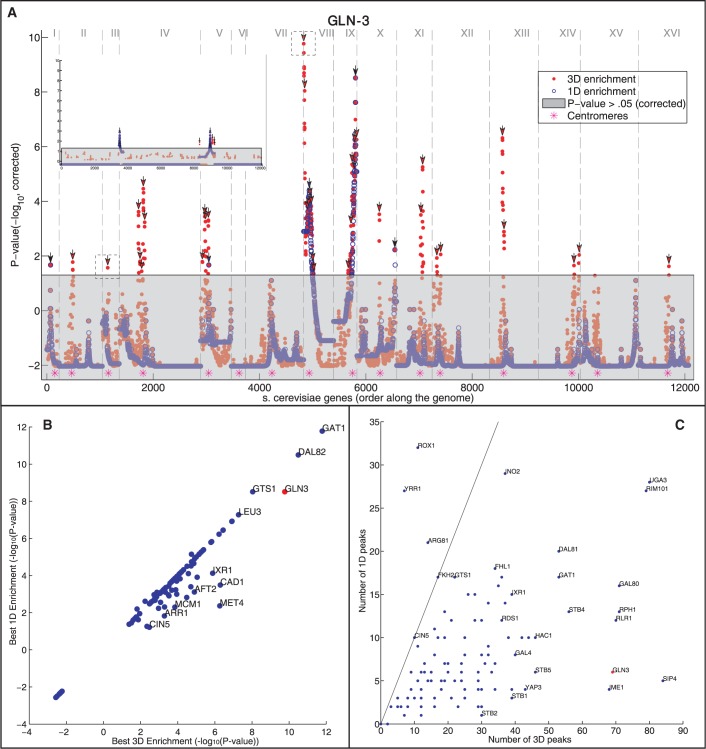
Figure 3.
Gene targets of the same TF generally spatially cluster in the yeast genome. (A) For each position in genome (x-axis, chromosomes are separated by vertical dashed lines), the P-value of the enrichment for GLN3 gene targets is shown (y-axis, −log10 of the mHG corrected P-value, see ‘Materials and Methods’ section). The enrichment values are shown for both the 3D (red) and 1D (blue) distances. Dotted boxes correspond to the environments shown in Figure 2B. Points in the grayed out region are below the significance threshold (P > 0.05, mHG, corrected). Peaks over the significance threshold are indicated by arrows. Top left inset shows the effect of running the same analysis on one random permutation of the target genes of GLN3 (B and C) Analysis on the gene targets of 107 TFs. GLN3 is marked in red. (B) A comparison between the maximal −log10 P-value for 3D and 1D enrichments for each examined TF. (C) A comparison of the number of significant spatial (3D) and genomic (1D) regions (peaks; marked with arrows in A, see ‘Materials and Methods’ section) for each examined TF. The line indicates a unity relationship.

