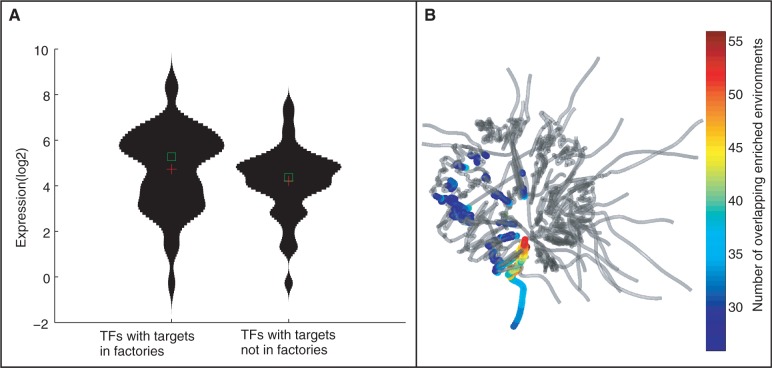
Figure 5.
Gene expression is higher for genes in regions of functional co-localization. (A) Violin plots of expression levels of TFs with and without spatially co-localized gene targets. The expression values are compared for the 50 TFs with the highest and lowest spatial localization score (-log of the ratio of t-test P-value comparing genomic and spatial enrichment co-localization). TFs with spatial co-localized targets have a significantly higher expression (P < 0.01, Kolmogorov–Smirnov test). (B) Spatial locations of transcriptional factories. Superimposed on the genome structure, for each gene the color indicates the number of instances that the 3D structure is more significantly enriched in gene targets with respect to the linear order.

