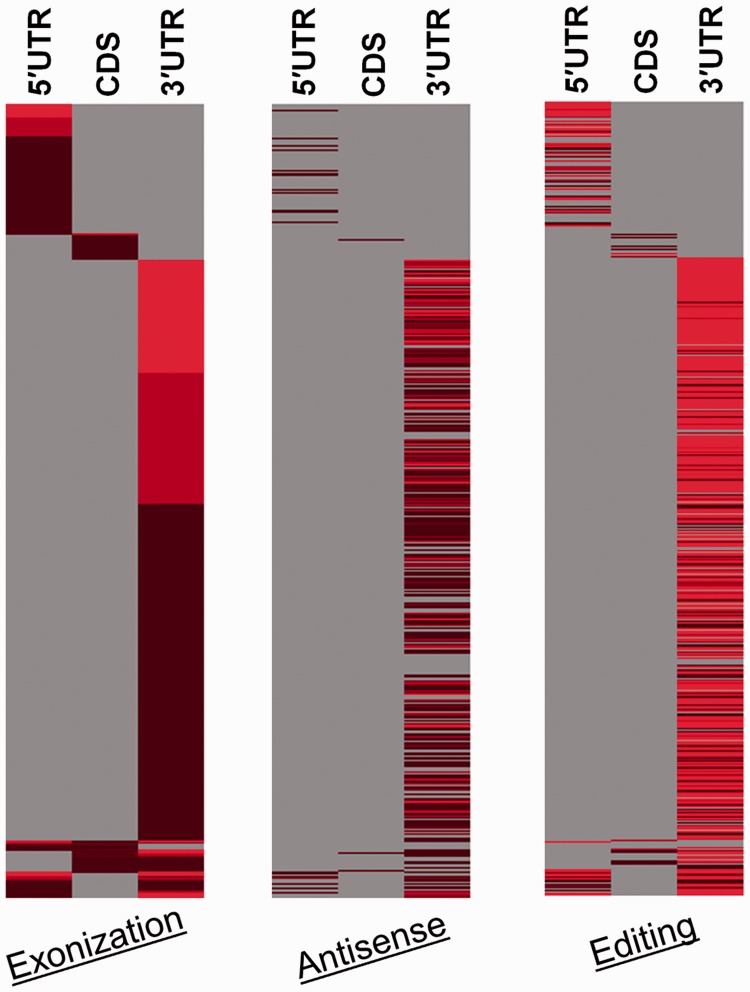
Figure 4.
Occurrence of Alu-mediated transcriptional events in different regions of genes. The figure is a heatmap depicting density of occurrence for Alu exonization, antisense and editing across 5′UTR, CDS and 3′UTR regions in each of the 3177 genes. Each row of the heatmap is a gene with the number of exonization (first panel), antisense (second panel) and editing (third panel) events summarized. The colour gradient from light to dark represents the magnitude of the related event, i.e. number of exonized Alus, number of Alu antisense targets and number of A→I editing events, respectively, with lighter colour representing larger number of events. As is evident, majority of genes exhibit extensive editing and antisense events in the 3′UTR.

