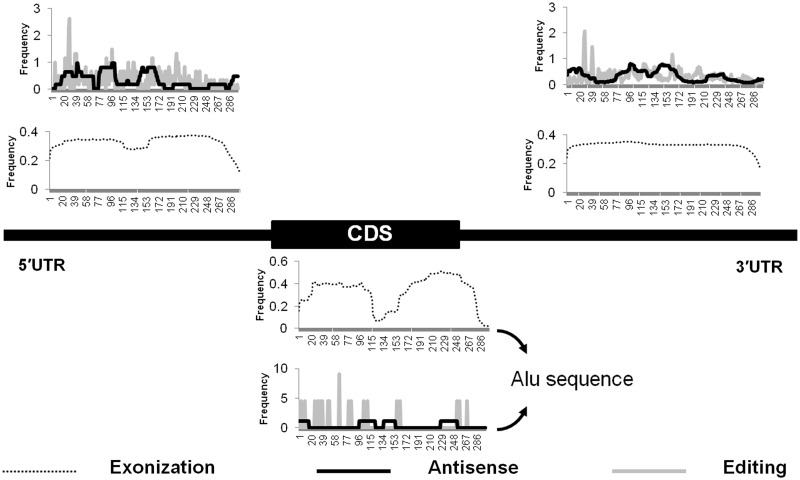
Figure 6.
Positional preference of exonization, antisense or editing events within Alu repeats in different genic regions. Base positions of full-length Alu are represented in the 5′UTR, CDS and 3′UTR, and the graphs are plotted based on the frequency of exonization, editing and antisense at each of the positions in the three genic regions. Y-axis indicates the frequency of occurrence of the particular base position along the length of Alu. In the 5′UTR or the CDS, either of the monomer of the full-length Alu is exonized, whereas in the 3′UTR, the full-length Alu is mostly exonized. The antisense events peak around ∼80–100th and ∼140–170th base positions in both the 5′ and 3′UTR regions. A→I editing has a clear peak at ∼17–45th base position. The number of antisense and editing events identified in CDS is miniscule compared with that in UTR regions.

