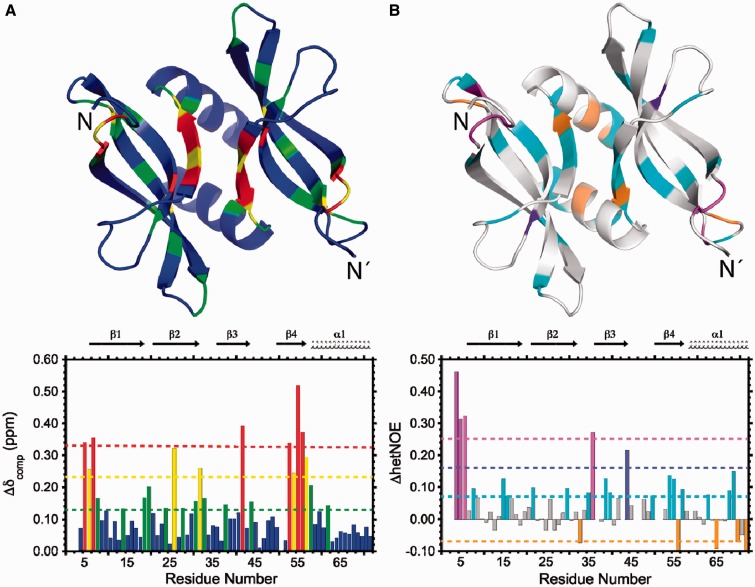
Figure 3.
NMR characterization of poly-dT binding to L. lactis YdbC. (A) CSPs (Δδcomp) histogram. The bottom panel shows colour-coded residues defined according to the magnitude of the deviation from the mean CSP (green dotted line); yellow dotted line: mean + 1σ; red dotted line: mean + 2σ. The CSPs are mapped onto the apo-YdbC structure in tube representation. (B) {1H}-15N heteronuclear NOE difference (ΔhetNOE) between ssDNA-bound and apo-YdbC. The histogram (bottom panel) shows colour-coded residues defined according to magnitude of the deviation from the mean ΔhetNOE (cyan dotted line); purple dotted line: mean + 1σ; magenta dotted line: mean + 2σ. The ΔhetNOEs are mapped onto the apo-YdbC structure in tube representation with the same colouring scheme.

