Figure 2.
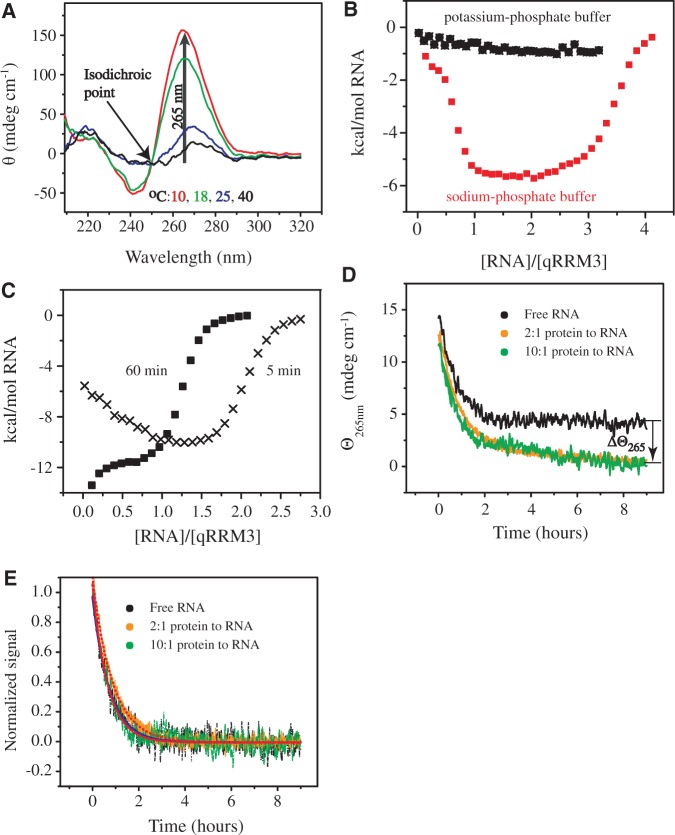
Binding of qRRM3 to G-tract RNA proceeds by conformational selection. (A) CD spectra of 100 μM 5′-AGGGAU-3′ measured in sodium phosphate buffer at different temperatures (indicated in the figure). (B) ITC binding curves measured at 10°C after injecting 150 μM 5′-AGGGAU-3′ into 10 μM qRRM3 in potassium phosphate buffer (black) and in sodium phosphate buffer (red). (C) ITC binding isotherms after titrating 150 μM 5′-AGGGAU-3′ into 10 μM qRRM3 at 20°C in sodium phosphate buffer with different equilibration time between successive injections amounting to 5 (crosses) and 60 min (squares). (D) CD time course measurements at 265 nm and 298 K showing the dissociation of G-quadruplex in the absence of qRRM3 (black), in a 2-fold excess of qRRM3 (40 μM; orange) and in a 10-fold excess of qRRM3 (200 μM; green) to RNA monomer (20 μM). The dead time was ∼20 s. Δθ265 represents the change in G-quadruplex content at equilibrium due to the protein. (E) The figure shows the same data as in (D). The relaxation data was normalized from 1 (starting point) to 0 (final point). The solid blue line and the dotted and dashed red lines represent single exponential functions best describing the experimental data in the presence of 0, 40 and 200 µM qRRM3, respectively. The half-life of G-quadruplex dissociation is 30.5, 35.8 and 27.4 min for free G-quadruplex RNA and at 2 - and 10-fold excess of protein to RNA, respectively.

