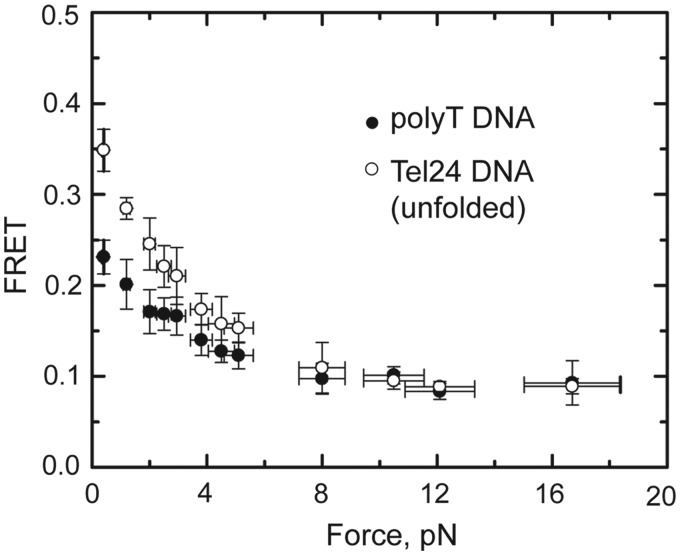
Figure 4.
Force response of Tel24 low-FRET (unfolded) state and polyT DNA. The average FRET values of the Tel24 low-FRET (unfolded) state (open circles) and a 24-nucleotide polyT DNA construct (closed circles) are plotted as a function of force. Y-axis error bars are the standard deviation of the average FRET value measured for at least five individual molecules at each force set point, and x-axis error bars reflect an ∼10% systematic error in the calibration of the applied stretching force.

