
Figure 1.
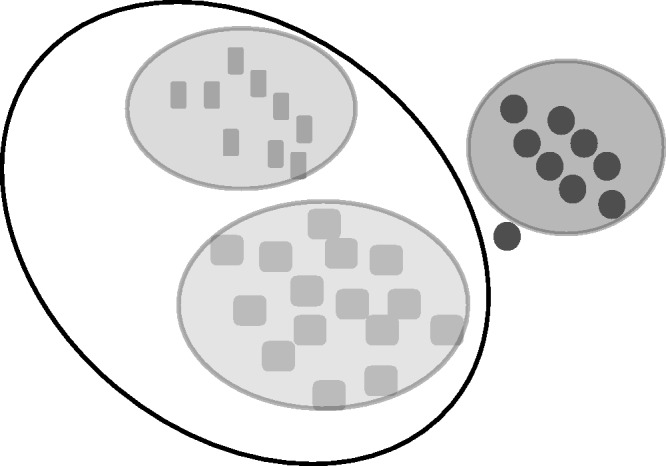
The schematic diagram of ellipsoidFN. ellipsoidFN tries to represent each cancer type by ellipsoids in the gene space and maximizes the distance between ellipsoids. A meta-ellipsoid (black) can be added to represent the relationship between cancer types.