
Figure 3.
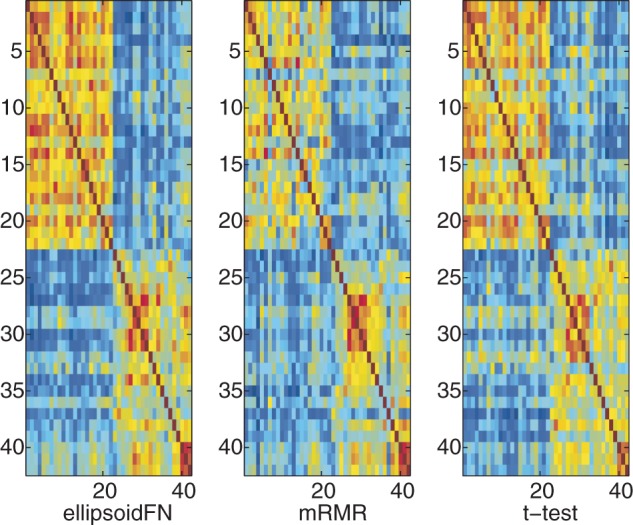
The sample similarity based on biomarkers identified by ellipsoidFN, mRMR, and t-test on the prostate cancer dataset when only two classes were considered. Red means high similarity. Blue means the opposite.
Official websites use .gov
A
.gov website belongs to an official
government organization in the United States.
Secure .gov websites use HTTPS
A lock (
) or https:// means you've safely
connected to the .gov website. Share sensitive
information only on official, secure websites.
The sample similarity based on biomarkers identified by ellipsoidFN, mRMR, and t-test on the prostate cancer dataset when only two classes were considered. Red means high similarity. Blue means the opposite.