
Figure 1.
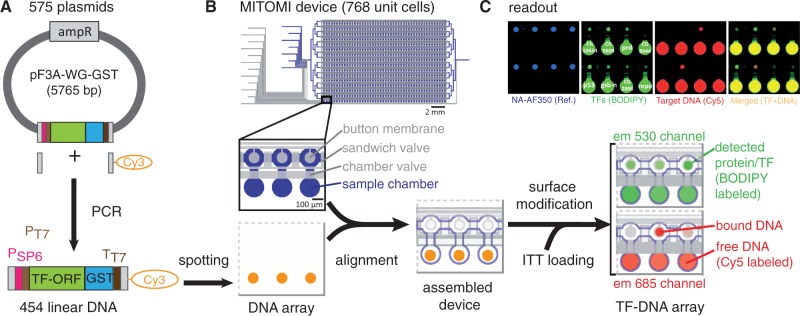
Experimental workflow. (A) Linear DNA templates were generated from plasmids by PCR. (B) PCR reactions were directly spotted onto a glass slide and aligned to a microfluidic device containing 768 unit cells. After surface modification and on-chip protein synthesis, TF–DNA interactions are detected by scanning the device on a fluorescence DNA microarray scanner. (C) A typical readout shows the TF–DNA pull-down area, stained with AlexaFluor350-labeled NeutrAvidin (blue), TF expression (green), bound target DNA (red) and the TF–DNA interaction of the merged channels.