
Figure 2.
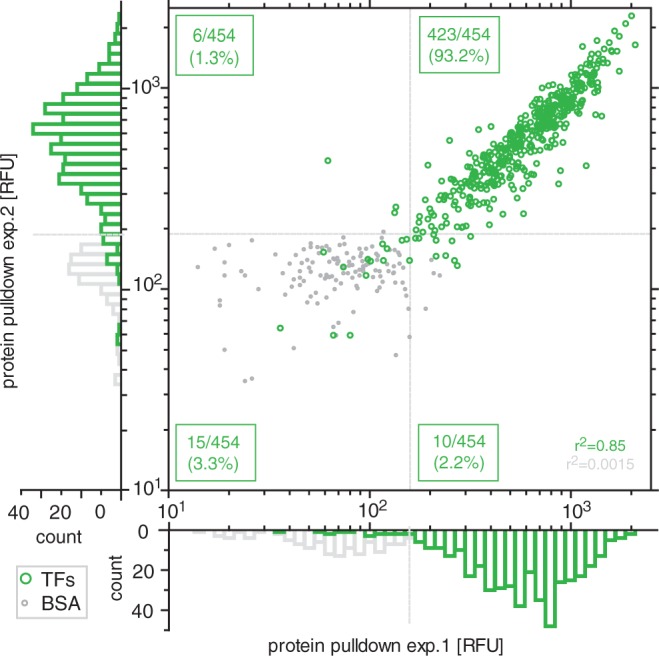
Correlation of protein expression levels (TF) and negative controls (BSA) from two different chips. Dotted gray lines indicate the background threshold (2 s.d. above the mean of the negative control).
Official websites use .gov
A
.gov website belongs to an official
government organization in the United States.
Secure .gov websites use HTTPS
A lock (
) or https:// means you've safely
connected to the .gov website. Share sensitive
information only on official, secure websites.
Correlation of protein expression levels (TF) and negative controls (BSA) from two different chips. Dotted gray lines indicate the background threshold (2 s.d. above the mean of the negative control).