
Figure 3.
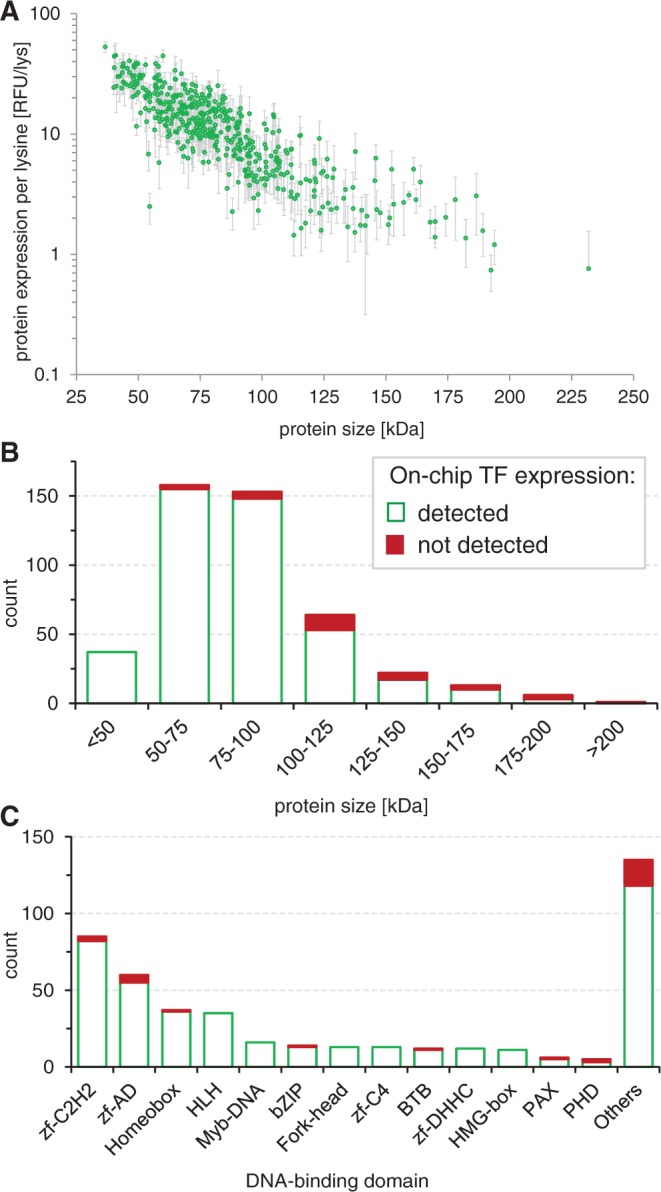
On-chip protein expression. (A) Expression levels (normalized to the number of lysine residues per protein) as a function of protein size of all 454 TF for six experiments (error bars: standard deviation). Histograms of (B) protein size (C) and DNA-binding domains of the expressed Drosophila TFs.