
Figure 4.
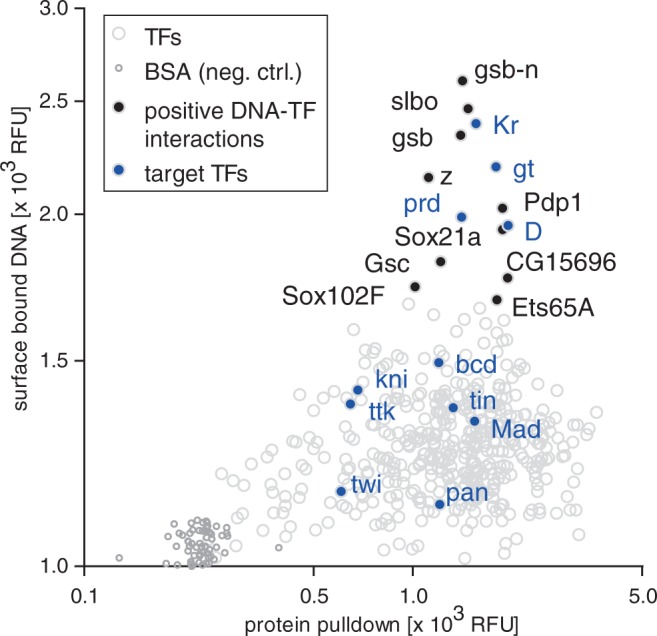
Detecting TF–DNA interactions with iSLIM. Scatter plot showing the DNA binding as a function of protein expression for all 423 TFs on the array to a pool of 12 DNA consensus motifs for TFs involved in the even-skipped GRN. Interactions are represented as gray circles. Highlighted are targeted TFs expressed on the array (blue) and additional TFs that interacted with the consensus sequences (black).